Making Business Insight Dashboard Components with Report Studio
Dashboarding with Business Insight
Business Insight is a new tool in Cognos 10. With it, pieces of existing reports can be combined into interactive dashboards. This allows users with less report authoring experience to create dashboards using components from more complex reports. (Business Insight should not be confused with Business Insight Advanced, a report creation tool alongside Report Studio or Query Studio that was also introduced in Cognos 10).
While Business Insight can use nearly any report item (chart, list, crosstab, etc.), there are some techniques and best practices which can make these items more “Business Insight friendly”.
Report Studio Best Practices
Business Insight dashboards can include any list, crosstab, chart, or table from a Cognos report (as well as entire reports plus a few other less commonly used items). This can be very powerful. Often, however, items pulled from different reports might not make the best candidates to fit together in a dashboard. There might be differences in layout (such as different font or background color choices), or the data displayed might not match (the filters used might involve different assumptions or views of the data, for example). There are a few best practices which can help make dashboard construction more successful.
Name your report objects
When browsing for report elements in Business Insight, each item (table, crosstab, etc.) is shown using its name. If these are all “Crosstab1”, “CombinationChart2” type names, it can be difficult to find the right item.
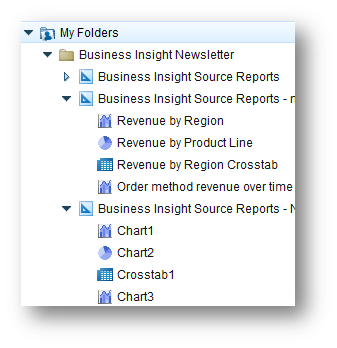
Which of these above menu’s is easier to browse?
Setting the Name property for each item in Report Studio or Business Insight Advanced to a more readable name, and keeping the names consistent across reports, will avoid this problem. (In Business Insight Advanced 10.1, the name of an element cannot be edited; this functionality was added in the 10.1.1 update.)
It’s also possible to keep items out of Business Insight completely. If the Name property of an item is blank, that item will not show up in the Business Insight Content tab. This can be used to keep an item from being misused, or to require items to appear together (for example, by creating a named table with several report elements inside it; give the table a name and give everything inside a blank name).
Create dedicated Business Insight reports and folders
While it can be useful to be able to take any report item and include it in a dashboard, it is difficult to guarantee layout or data consistency. It is often a good idea to create some dedicated “building blocks” reports that are not designed for display on their own, but instead as a holding area for multiple Business Insight elements. By storing these reports in a central folder, a large repository of dashboard components can be created and maintained easily. This practice also allows the naming standards for dashboard components to be independent from other naming standards which might be used for dedicated Report Studio reports.
Use consistent sizes where possible
Dashboards look best when items are the same size, or simple multiples of that size (50% as wide, twice as tall, etc.). Business Insight allows resizing, but if items are consistently sized to begin with, it’s easier and faster to create new dashboards. Use the Size & Overflow property in Report Studio to set height and width for each element.
Filtering Dashboard Items
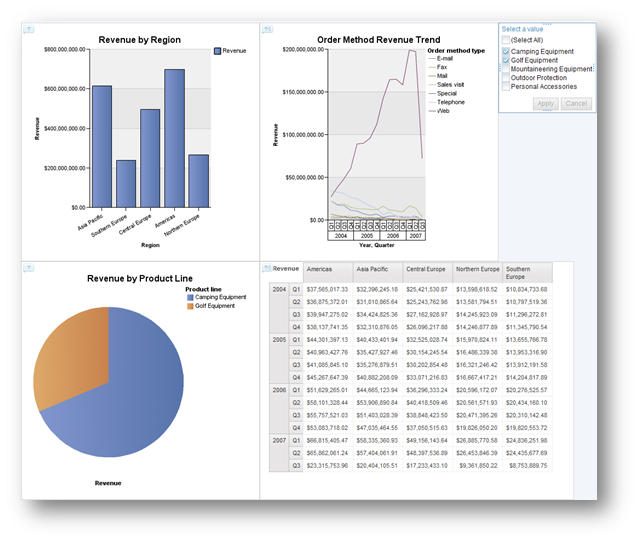
One issue that can arise when building a dashboard is creating a single consistent filter across multiple objects. In the below example, each item will only filter by data fields that it uses. In the example below, the Revenue by Region chart can filter by Region, but not by Order method type or Product line.
One way to solve this is to add prompts or extra axis items to each report, but this can affect the appearance and performance of each item.
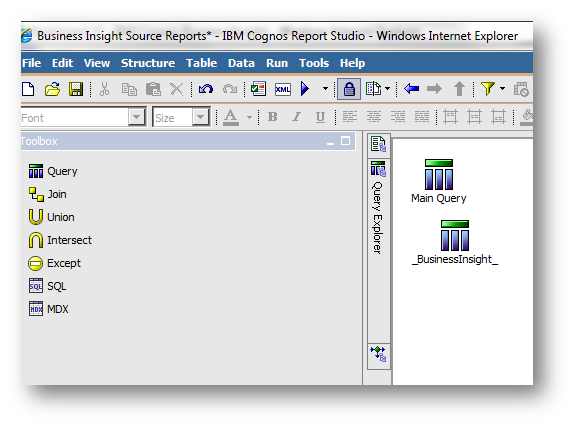
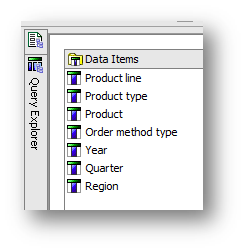
A better way for Business Insight objects is the use of a special query named “_BusinessInsight_” (that’s BusinessInsight with an underscore character before and after it). If a data item appears in both the _BusinessInsight_ query and the query used for a report element, that data item can be used as a filter in a Business Insight dashboard.
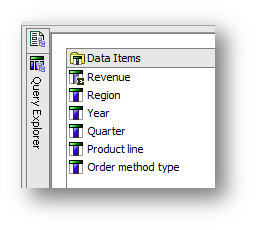
(Note that all three charts and the crosstab in the above example were created in a single Report Studio report, and all use the same query for their data.)
|
|
|
|
Contents of Main Query |
Contents of _BusinessInsight_ |
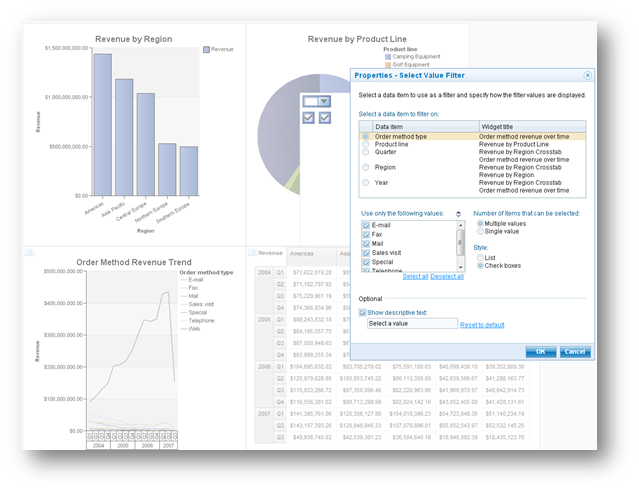
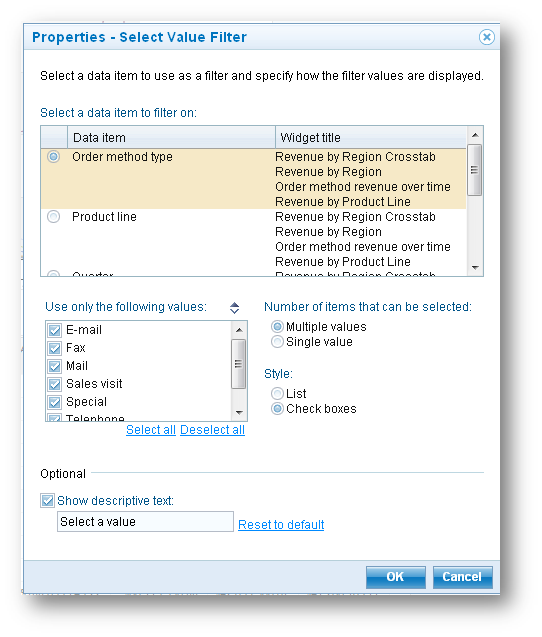
Once this work is done in Report Studio, the filtering options become much more varied. It’s easy to add extra data items to the query, since there is no need to worry about creating prompts or managing the layout. This will allow a dashboard to filter all elements across separate data items:
Plan for Dashboarding Success
Creating an environment for optimal dashboard creation takes a little preparation and maintenance. These techniques will help create a structure around which users can build new dashboards and manage data in whatever way they might require.