Boosting the Power of SPSS Statistics with Python

What Python Is and Why to Use It
Python is a powerful open source general-purpose programming language. Through an easy-to-use structure, it allows users to perform a huge variety of controlling tasks on a computer.
In the case of using the Python plug-in for SPSS, it enables one to control the program flow based on conditions, to execute different syntax dynamically and interactively according to intermediate results, to apply command extensions and unlimited Python modules for more complicated algorithms, etc.
Because of its power, agility in every technology arena from the desktop to the server and intuitive syntax, Python has gained huge popularity not only in software development, but in data mining as well. In a KDnuggets poll that surveyed people about the languages they use for data analytics and mining last year, Python ranked second among all the languages. Therefore knowing how to use Python also facilitates the integration and migration from Python programs to SPSS Statistics.
How Python and SPSS Are Integrated
SPSS Statistics 22 is fully integrated with Python. After selecting to install Python Essentials and Plug-in at the installation, one can start to program with the language in an external mode (in Python Command Line or IDLE or an internal mode using the syntax editor of SPSS statistics). In both of the modes, Python codes can call SPSS commands syntax and in the second mode, you can mix SPSS Statistics syntax with Python.
An Application for Data Manipulation
As many of you probably have realized, data preparation usually takes up to 80% of the analytical work in an advanced analytics project. In this section, we will present an example of how Python can facilitate the process of data manipulation and preparation.
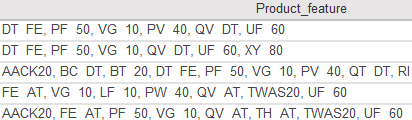
Suppose you are working on a manufacturing dataset, with each record being a transaction of a product. One of the variables is product_feature, which gives a list of comma-separated feature codes of the products sold. To model which feature have the most affect on the sales of the product, it’s necessary to extract all the features of each product sales record and make each of the features a dummy indicator.
See a sample of records of the variable product_feature in the dataset below:
Original dataset:
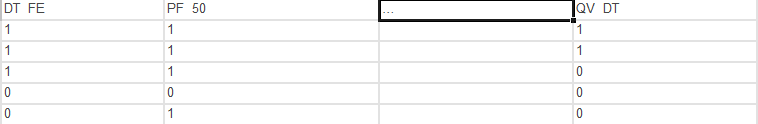
The result dataset should appear in the following format:
Our example is similar to transposing, but what makes it much more complicated is that the row values being transposed to columns have sub elements in each of them, which need to be made into columns respectively. Also, the number of the elements contained in each feature value are different, not to mention the elements themselves are also different.
For this problem, we can apply Python’s elegant sequence indexing and slicing operations. Note, the use of number signs (#) indicate comments for the code (as shown below).
#Step 1: Generate a master accessory list from the union of all sets of accessory codes of each record
ifile = open(‘JM_Family.txt’,’r’) #create a file object for the actual dataset(the report)
reportread = csv.reader(ifile, delimiter = ‘t‘) #create a reader object from the file object
acclookup = []
for row in reportread:
if reportread.line_num >1: #excluding the header row
#Pieces all the values of the variable (second column in the dataset and indexed to 1) and make the #result a big list
acclookup.extend(row.split(“, “))
acclookup = (list(set(acclookup))) #remove duplicates
acclookup.sort()
#Step 2: Create dummy variables and populate with 0 and 1 from acclookup and write the result to the file
ofile = open(‘accw.txt’,’w’) #create a file object for writing the result
reportwriter = csv.writer(ofile) #create a writer object
ifile = open(‘JM_Family.txt’,’r’)
reportread = csv.reader(ifile, delimiter = ‘t’)
for row in reportread: #for each row in the read tab delimited file
if reportread.line_num == 1:
row.extend(acclookup)
reportwriter.writerow(row) #write column headers to the file
else:
accdummy = * len(acclookup)
acclist = row.split(“, “) #read the 2nd column(2nd column is indexed to 1) and turn it into a list
n = len(acclist) #count how many items (accessory codes) there are in each list
for i in range(n):
pacdum = acclookup.index(acclist)
accdummy = 1 #write the dummy values ( 1 for occurrence and 0 for nonoccurrence)
row.extend(accdummy)
reportwriter.writerow(row)
ofile.close()
The above program first creates a master list of all the codes appearing in the variable, then it loops through the dataset line by line again to use the list index method to find out if a certain code appears in the record. If yes, Python marks one for this record in the master list.
The final dataset has the original data and dummy variables of all the codes.
There are three ways to execute this program with SPSS Statistics:
After you save the program, you can run the script from the script editor, which is launched when opening a Python file (.py) from File>Open>Script or from Utilities>Run Script. You could also copy and paste the code between BEGIN PROGRAM PYTHON. and END PROGRAM. using the SPSS Statistics Syntax Editor.
There are some differences between the first approach and the second approach. To begin with, the first approach will invoke Python IDLE and the script will be evaluated by Python Shell, meaning any print command results will be shown in the Python Shell window. Moreover, if you choose the first approach to run your code, you don’t have to specify the directory where a file sits, as long as the program is saved in the same directory with the file. With the second approach, however, you have to specify the full path as well as the program’s name when referring to a file.
There are many ways to integrate coding options into your predictive analytics efforts. Our Data Science & Advanced Analytics team is full of experts who can help you use languages like Python or R to their full effect. We’d be happy to help you get predictive.