IBM Cognos 10- Business Insight Explained
As we mentioned in last month’s newsletter we will be featuring articles regarding IBM Cognos 10 for the next several months in order to bring our subscribers up to speed on the newest IBM Cognos offering. In prior months we had discussed our initial reaction to IBM Cognos 10, Active Reports and this month we will be reviewing the all new Business Insight interface.
This new interface is geared towards the business user, providing them with a suite of powerful tools to access, analyze, and format BI content with minimal training. Let’s go ahead and get started with how best to make use of this new tool.
What is Business Insight?
Designed to replace Go! Dashboard as well as certain components of Query Studio and Analysis Studio, Business Insight is a new WYSIWYG workspace in which business users can easily create and share interactive dashboards, modify layout, colors, text, add notations/comments and personalize widgets. With this interface and the multitude of new capabilities offered within the studio, the need to involve IT or to switch between studios to answer basic business inquires is greatly reduced. It is very important to note that this is not an interface designed to develop reports from a metadata model, but is intended to give end users, with very little training, the capability to pull information from multiple prebuilt reports or other sources and combine them into a single dashboard style interface. The user does have the ability, as you will see below, to interact with the data found in these reports.
The WYSIWYG interface:
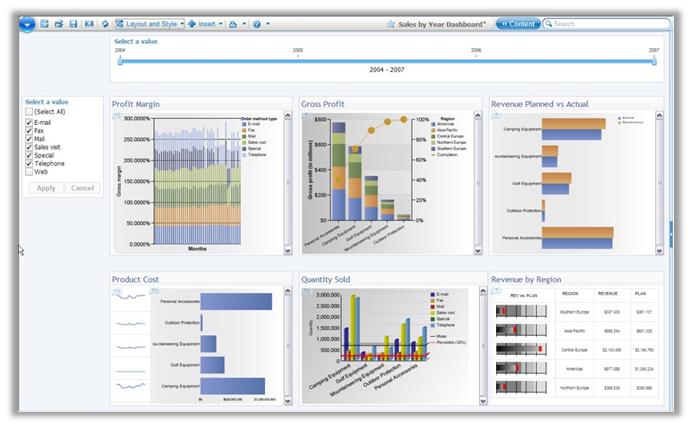
Getting Started: What can you access?
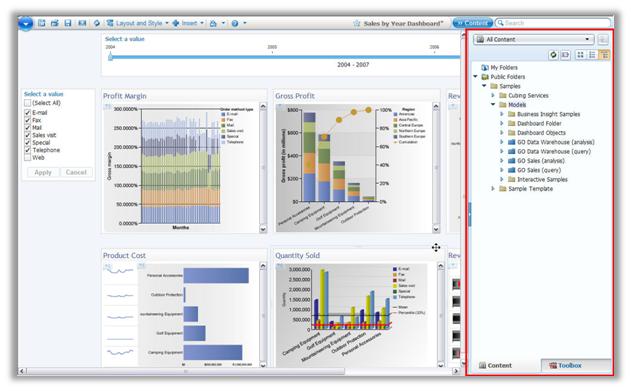
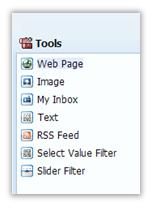
In order to get data into the WYSIWYG workspace, users select objects from the Content Store Toolbox. The Content Toolbox is split in two sections: Content and Tools with a myriad of objects previously only available through the IBM Cognos Go! Dashboard interface. The primary goal of these objects is to simplify the end user experience while still providing the breadth of functionality necessary to create business ready distributable reports able to answer critical data requests. A user can select an entire report, a subset of a report, a URL, value or slider filters, images or even web pages to drag and drop as widgets in their workspace. A comprehensive list of available content and a screenshot of the toolbox are below:
Content and Toolbox Area Highlighted in Red
BI Content:
|
TM1 Content
|
Metric Studio Content
|
Tools
|
Formatting and Interacting with your Content
After dragging objects from the Content Store Toolbox into the workspace a user can now modify each object (widget) individually, allowing them to customize the display to their liking. Users can move widgets around, change color palettes, resize widgets, change chart types, convert lists to crosstabs and vice versa.
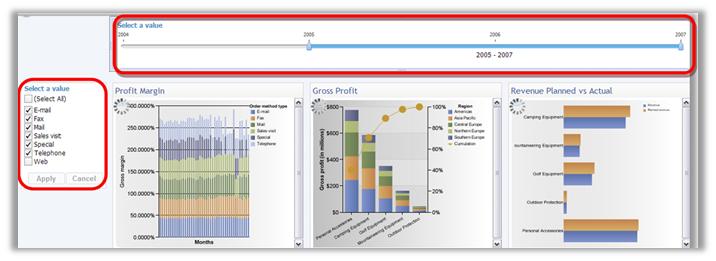
Data can be analyzed within Business Insight itself by utilizing features such as drill up/down functionality, applying filtering, adding calculations, grouping and sorting. Prompting can be placed directly into the workspace as well, allowing users to modify prompts on the fly.
Notice the slider bar and check boxes (highlighted in red) that allow you to adjust prompt filters within the interface:
Once satisfied with the layout of data, a user can export conveniently to a number of file formats: XLS, PDF, CSV, XML and PDF.
Where does Business Insight Fit in?
Go! Dashboard
Business Insight is the upgrade path for Go! Dashboard and other than the ability to utilize Flash-animated charts and client-side charting, retains all the functionality that Go! Dashboard offered. Go!Dashboard objects are directly upgradeable to Business Insight.
Query Studio and Analysis Studio
Business users of Query Studio and Analysis Studio found a rather complex suite of options providing users with a number of different functions to create reports to deliver information. Often, a non-technical user would be overwhelmed with even a simple request. With the WYSIWYG interface, Business Insight users may find it to be more intuitive and thus easier to learn and have a simpler path to answering business questions.
Report Viewer and Cognos Connection
Business users who find that Report Viewer and Cognos Connection do not provide enough interaction and formatting ability may find that Business Insight is ideal.
Overall Initial Impression
The first thing I noticed when I began using Business Insight is just how intuitive IBM has made the interface. Finding tools and learning how to drive this studio couldn’t be easier. Even with a very simple interface you are still able to accomplish quite a bit. A basic business user can easily create a great looking interactive dashboard in short time. I was pleased with the ease with which you could add outside sources such as webpages. I foresee many people embedding frames of their corporate intranet sites within their dashboards.
There is an option to fit all your widgets to the window which I found convenient. I was more impressed by the ability for Cognos to perform a geometric task of arranging your widgets (of different shapes) to fit content. It is an easy shortcut for users who do not have any particular layout in mind. Simply place all your content into the workspace and let Cognos get you started with how to organize it.
Limitations
All this new functionality does not come without its limitations. Creating complex dashboards may necessitate many separate queries to be run which can negatively impact performance. When creating content to be used in the Content Toolbar, administrators should be aware of the use of complex objects and take steps to limit objects to smaller and more manageable reports. What does this really mean? Much of the content used in Business Insight will come from pieces of actual reports. Often times there are complex objects created in Report Studio which may not perform well when combined with other objects already on the dashboard. Limiting business users to smaller faster objects will increase performance and provide for a better experience.
Coming Soon: Business Insight Advanced…