IBM Cognos Tabbed Report Design
Often times developers will get a request to create several different variations of a single report. While this can be done with user prompting or even multiple versions of a report, another option would be to create tabs within a report which would allow for the user to easily switch between variations. In this month’s tech tip we’ll go over how to create this using drill-throughs, a string variable and a conditional block.
The first step is to identify what tabs you’ll want to display. Each one of the tabs will need to be set up individually. In our example (sample included) we’ll use the seven days of the week.
Create a Query
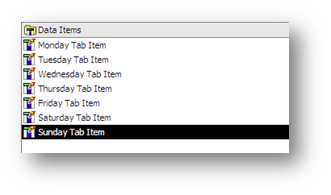
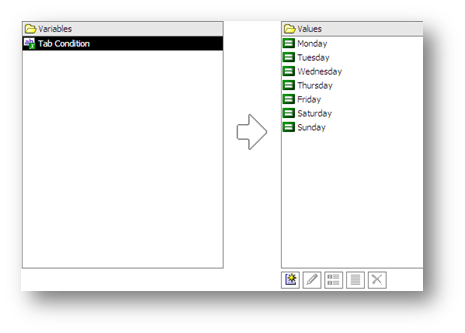
Create a new query to be used solely to hold the tab values. Call it “Tab Query” and create data items for every tab that you’d like to appear. The expression definition should be a string encapsulated in single quotes.
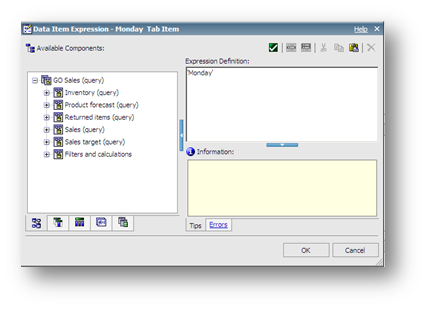
The end result should appear as below.
Create a String Variable
Next let’s go ahead and create a string variable called “Tab Condition”. Define the expression as shown below:
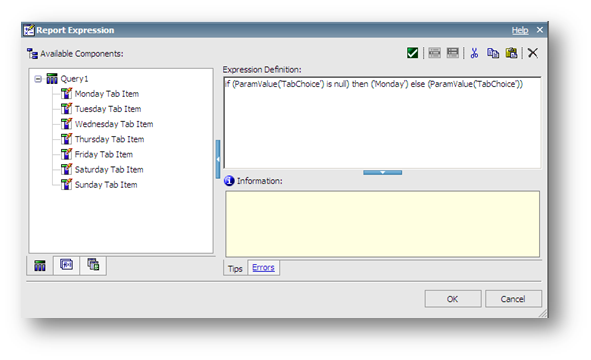
if (ParamValue(‘TabChoice’) is null) then (‘Monday’) else (ParamValue(‘TabChoice’))
This expression will set a default tab value for the report.
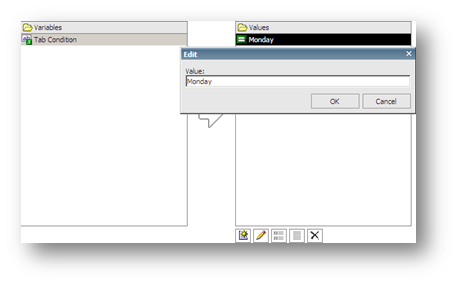
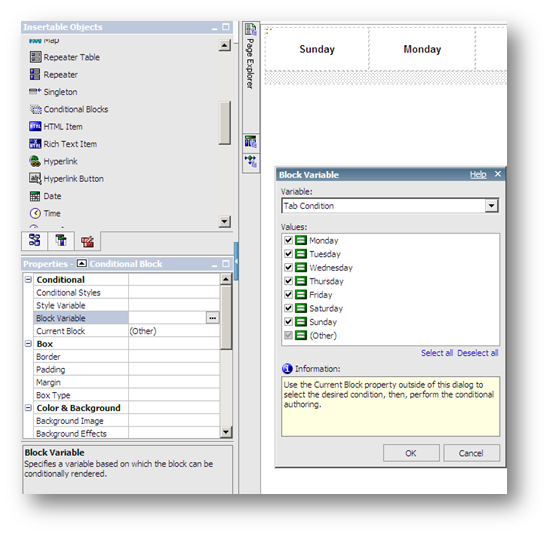
Next, we will need to create a string value to correspond to every data item we created in the query.
Note: The values of this variable must exactly match the expression definition of the data items we created. It is not necessary to use single quotes when defining the values of the string variable.
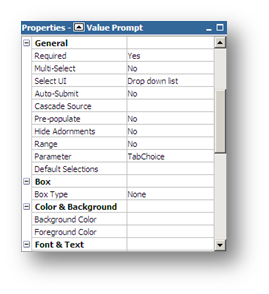
Create a Hidden Value Prompt
Drag a value prompt onto the page. Name the parameter “TabChoice” within the prompt wizard and click “Finish”
Once created, within the properties menu, set the Box Type to “None” in order to make this prompt disappear.
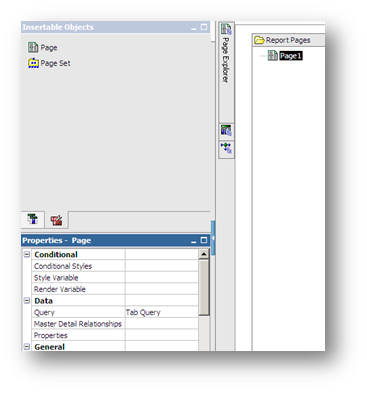
Associate the Query to the Page
Navigate to the page explorer. Select the page we are working on and associate it to the Tab Query we created in the earlier steps.
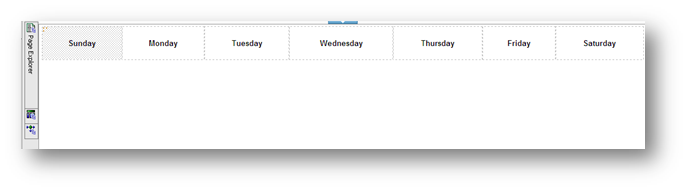
Create Tabs
Navigate back to the report and drag a table object onto the page. Define it with 7 columns and 1 row. Drag Text Items into each one of these cells and name them appropriately with each day of the week. Add 20px of padding to each one of these cells.
Define a Conditional Block
Drag a conditional block below the table.
Set the block variable to “Tab Condition” that we created earlier.
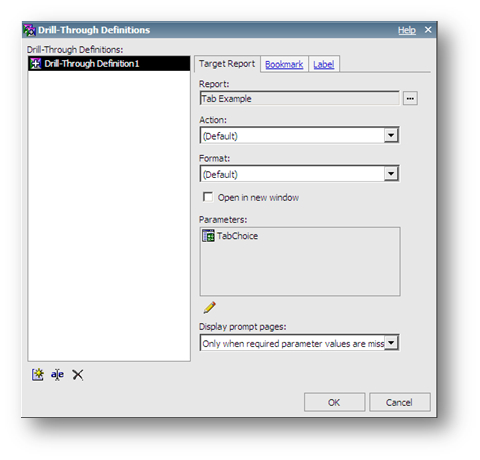
Create Drill Throughs:
At this point we’ll need to save the report (call it Tab Example) in order to create a drill through to itself.
Once saved, select one of the tab text values and select Drill-Through Definitions from the left hand Properties pane. Point the drill-through to the Tab Example report.
Define parameters by passing data item values of the corresponding data item
For example, if you are defining the Sunday drill-through then select the Sunday Tab Item.
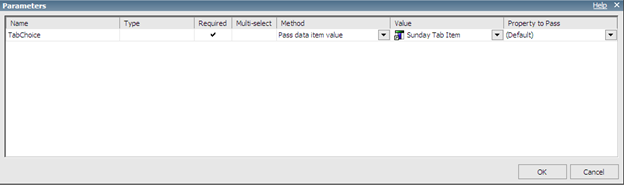
Repeat the drill through definitions for every tab value.
Select Variable Conditions and Produce Content
We are almost done. All that’s left to do is to develop your content.
Select the conditional block and change the Current Block property to different values. Each one of the values corresponds to a tab. Place your content within the conditional block and test!
Additional Considerations
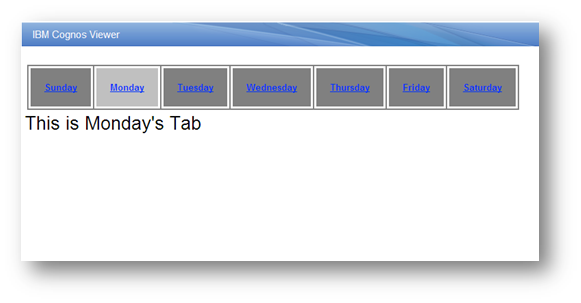
It is a good idea to conditionally format the table cell (tab) to show active versus inactive tabs. This way users will always know which tab they are currently viewing.
Save frequently. Because this report drills through to itself, any changes made will not be reflected until the report is saved.
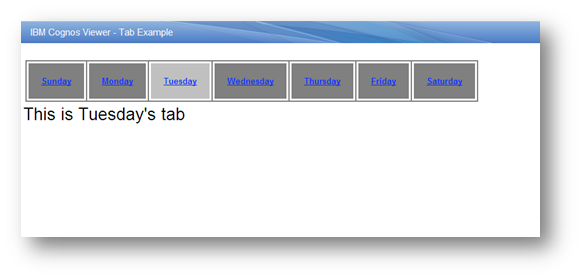
Sample Report
Included is a sample report xml which you can bring into Report Studio. Tab Report Example