Best Practices in Getting Started with a Pixel Perfect IBM Cognos Active Report
The popularity of IBM Cognos Active Report has been steadily gaining and as a result, the bar continues to be raised. Active Reports not only offer an incredible wow-factor because of their highly visual and stylized nature, they also offer powerful interactive capabilities that promise to take business analytics to a whole new level. In the past Ironside Group has written about overall Active Report best practices, but let’s assume you’ve already read those articles and still can’t figure out why your reports don’t look as professional as some of the samples you’ve seen. At the Ironside Group, we receive countless requests for assistance in shortening the learning curve to develop pixel perfect Active Reports. This article will walk through some best practices in getting started down the right path, in the hopes of reducing frustrating re-work.
Developing reports with Active Report differs from the normal Report Studio development process in that quite a bit of up-front planning is necessary if you are to produce something that is pixel perfect. Any changes realized during development may incur significant re-work and you will want to minimize the possibility of this happening. The following exercises should be completed before starting development.
Profile your control data
This may seem obvious, but it is a common step that many developers skip. When data appears in a way that is unexpected, you may need to make significant and time consuming changes to your report. Even if you are the subject matter expert in this area, still profile your data before you build. A little time spent up front doing this exercise will pay off.
Let’s take a look at an example.
You think it would be a great idea to create a Product button bar on the left and use the selection to drive some charts/lists contained in a data deck in the center of the report. You start building the report, sizing objects properly as you go. When you’re at the point where you can test, you realize that the left hand button bar is too long (as shown below).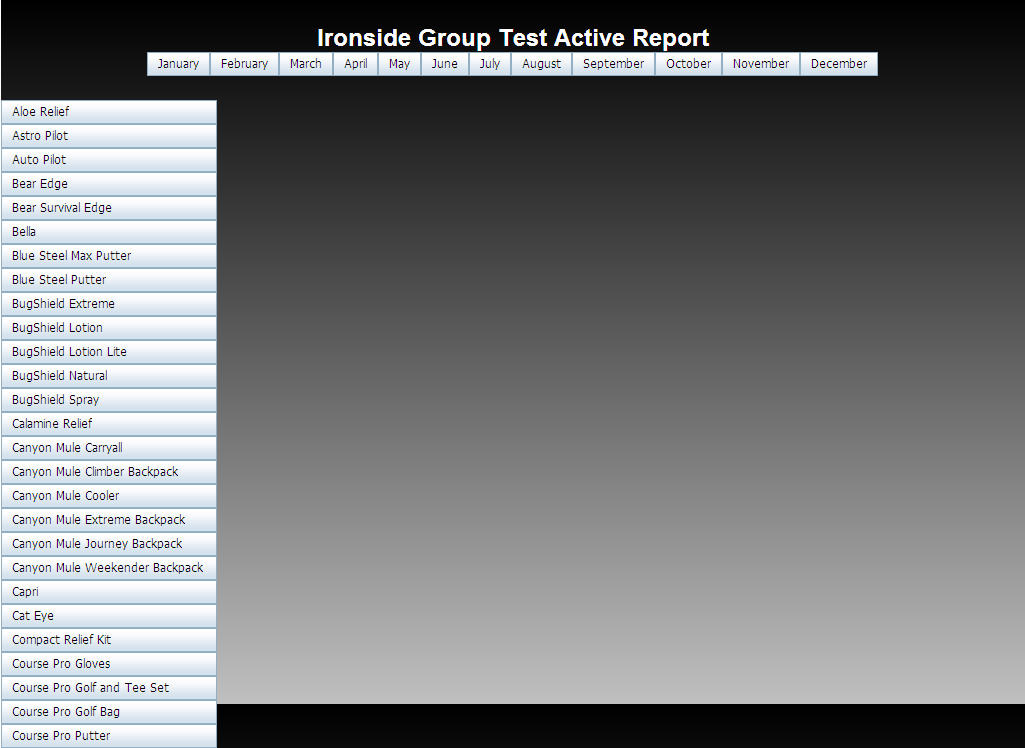
Steps will need to be taken to remedy this problem. One solution is to create another control and a master/detail relationship that allows you to essentially drill-down to a lower level. While this is not a huge undertaking in concept (add Product line), significant formatting work is required to implement it; more than you might expect if you are using standard report development techniques to gauge the level of required effort.
- Where will you put the new Product line control?
- How many other objects have already been sized around the left side bar?
- Did you account for all the objects in all the deck cards that will be affected (multiplying factor)?
Situations like this can result in hours of rework, testing and debugging. The lesson here, profile your data!
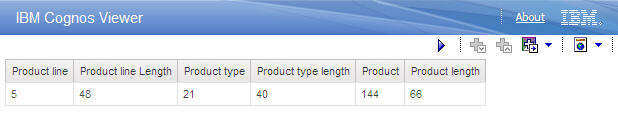
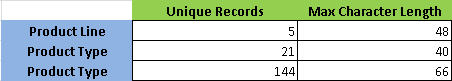
A quick matrix of required data items is something I’ve found quite easy to build within Report Studio and is helpful when wire framing your report.
Wire frame your report
Oddly enough, I have found myself going back to the basics when developing an Active Report. A pencil and a pad of paper have proved to be the most useful tools in building a wire frame of my next Active Reports. What is a wire frame? A wire frame is a skeleton of your report that shows controls, tables, objects and dimensions. Use wire frames to build the foundation of your report and get your sizing perfect first. If there are changes that are required at a later time, you can refer back to your wire frame to figure out what objects need to be modified to accommodate your changes.
Wire frame Essentials:
- Table and cells. Dimensions for all.
- Control information and a count of items (if using a data control).
- A separate page for every change in layout.
Example:
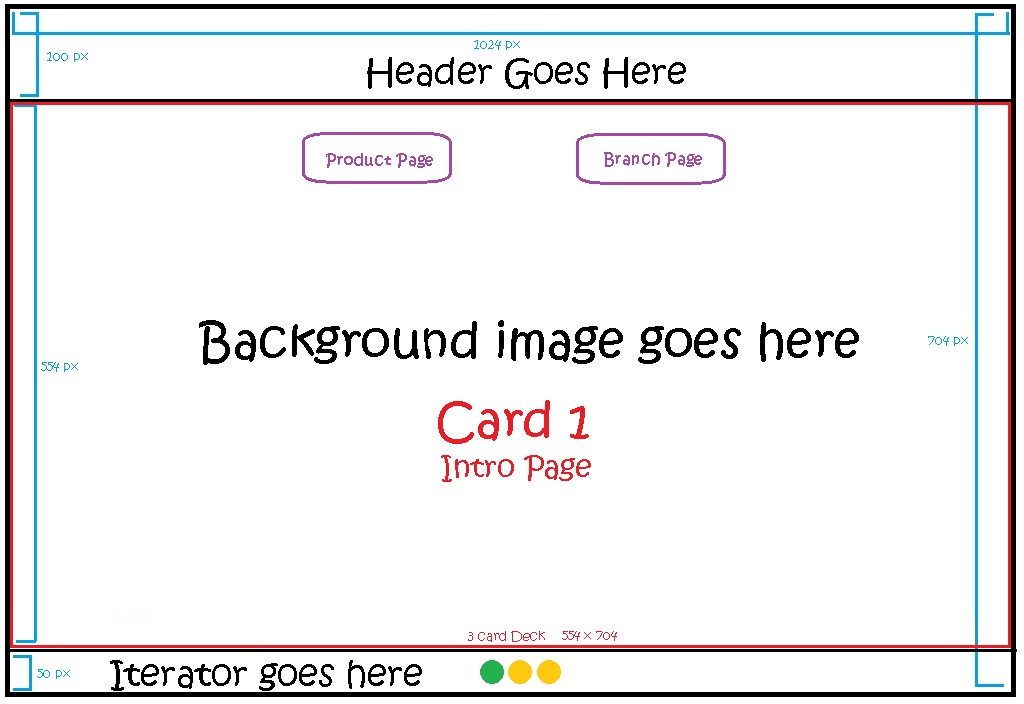
You are building a storyboard style Active Report meant for consumption on an iPad (704×1024). You’d like to maintain a consistent header and footer throughout the entire report. You’ll have an Introduction page, a Product page and a Branch page.
The wire framed Introduction page may look something like this.
The wire framed Product page may look something like this:
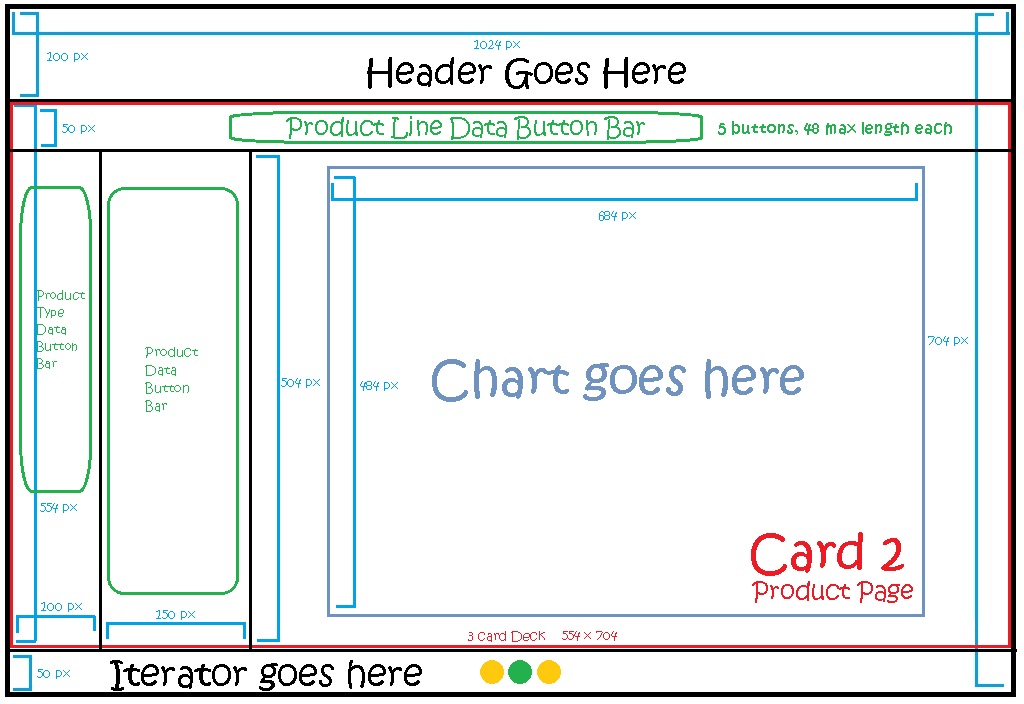
Imagine building this report without this wire frame as a guideline. How much of your development would actually be discovery? Using these wire frames as a blueprint for your report will speed up development time and reduce errors along the way. Walking through your report on paper will also help identify issues before you start.
As always, feel free to contact us for any questions you may have. More Active Report best practices will be forthcoming in future articles.