Ironside Tech Tip: Managing Performance Metrics in IBM Cognos 10

As Business Intelligence (BI) systems become more and more embedded into the critical, analytics-based DNA of corporate decision-making, it is more important than ever to keep the system up and running at the highest level of efficiency. This article discusses methods for providing real-time monitoring and historical trending information for your system in the form of performance metrics.
The article assumes a basic familiarity with setting IBM Cognos system metrics, which are available to the system administrator. For an introduction to system metrics, please see this article by Avdesh Singh, which does a great job of discussing the basics of IBM Cognos system metrics. His article covers the basics of setting targets and thresholds of various metrics. This allows you to perform real-time monitoring of your system metrics.
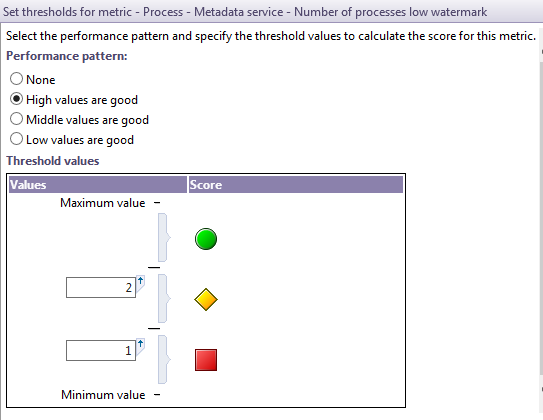
Each time a threshold is crossed, including upon system startup, an entry is written to the log file COGIPF_THRESHOLD_VIOLATIONS. At that point, this violation can be reported upon using the provided Audit package. In the example below, I set the metric Metadata service – Number of processes low watermark to purposely trigger threshold violations on my test system. This can be done for any of the performance metrics available on your system, giving you a very good picture over time of when your system is not performing optimally.
Knowing the current state of your metrics is essential, but how can you monitor the health of your system over time? It turns out there are ways to do this, as this article will show.
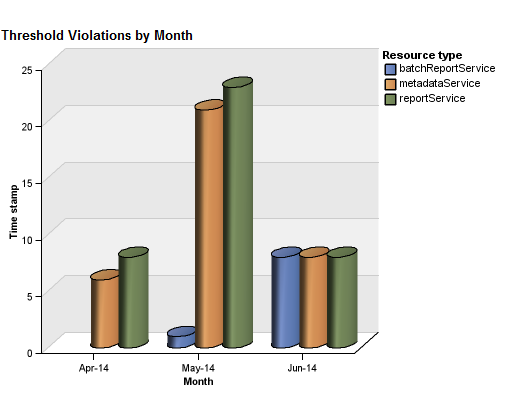
At this point, you can start to accumulate data over time that you can report on directly from the standard Audit package. For example, here’s a simple chart showing violations over time.
Real-Time Notifications on Performance Metrics
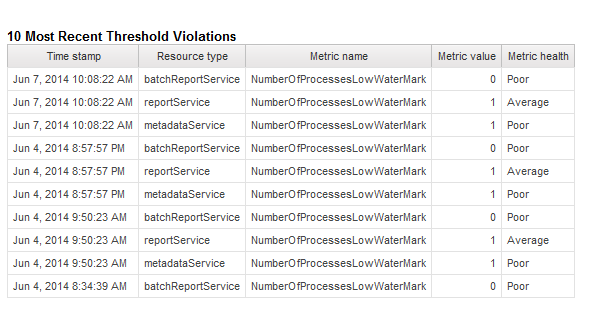
The next step is to add an Event Studio alert to notify the administrator of a sub-optimal performance condition. In the email alert to the Cognos administrator, you should include a simple list report with the 10 most recent violations or a similar report that effectively communicates the condition. Now the system administrator has rapid and useful information that allows them time to take corrective action when performance metrics aren’t being met.
System Management Methodology (SMM)
So where should you set your performance metrics? This is a very common question. IBM offers a free (but unsupported) set of tools to help you set and track your system metrics over time called the System Management Methodology (SMM). This is a very interesting set of tools, and it doesn’t seem to be widely known. Links to much more information on DeveloperWorks are at the end of this article.
Note: At the time of this article, IBM has not updated the SMM for Cognos 10.2, so the latest versions that this method is compatible with is 10.1.1. If enough demand for later versions is generated, IBM will most likely update SMM. Check the website for the latest information. Regardless, the methodology used to capture the information is still valid in all recent versions. The log files (see below) are in .xml format, so there are other programmatic ways to make use of the data generated. Also, the website has a very good description of the system metrics and Cognos services you can use. I recommend it as a valuable read.
The metrics values themselves are maintained with Java Management extension ( JMX) MBeans. This information can be manipulated so that it is read and then written to log files or even to a database. The DeveloperWorks website describes this process:
IBM Cognos BI system metrics are maintained by the Cognos Dispatcher and stored within JMX MBeans. When system metrics values are viewed within the IBM Cognos Administration Console, the values presented within the Metrics status panel are read from the system metric MBeans. These same metric values can also be read directly from the MBeans using any JMX monitoring tool such as JConsole which is included with a Java Development Kit (JDK) or an enterprise monitoring solution such as IBM Tivoli Monitoring.
The preferred approach is to capture the baseline system metrics. You enable this with two changes, one to the configuration file (metricdumpconfiguration.xml in the Configuration directory of your installation location) and the other by entering an advanced property in the system configuration. You may also need to set the JMX.
The Configuration file determines the scope and frequency of the logging. Unless there is a specific issue you are trying to identify, you could set the capture for a period of every 60 minutes each day, for example. The statistics are captured at a dispatcher level, so you need to repeat the process for every dispatcher you wish to profile.
Once you have a set of log files, you can automatically set the baseline metri c values based on the composite values captured in the log files. This is done using the CogSystemMetricAnalyzer tool. within the SMM. See the website for the details. Review the properties files to set the correct locations, filenames, java locations etc.
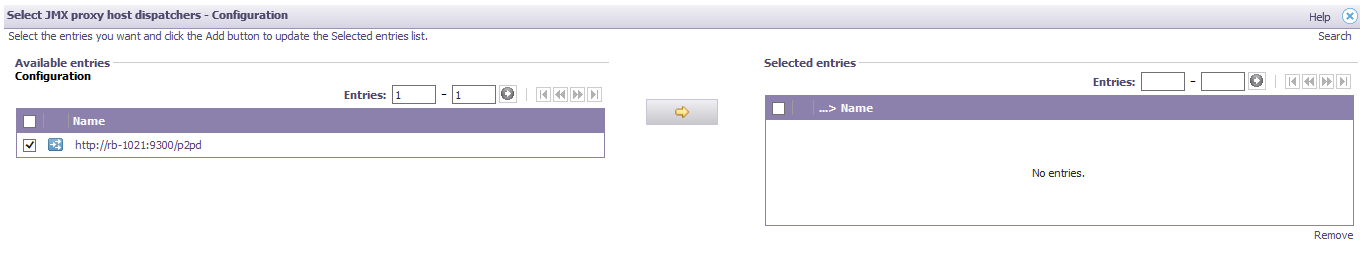
You may need to add the dispatcher to the list of JMX proxy host dispatchers in order to collect the metrics. To do this, from this system administration console, click on Dispatchers and Services. From the top level set of icons, click Set Properties. On the Settings tab, click the Edit link beside JMX proxy host dispatchers.
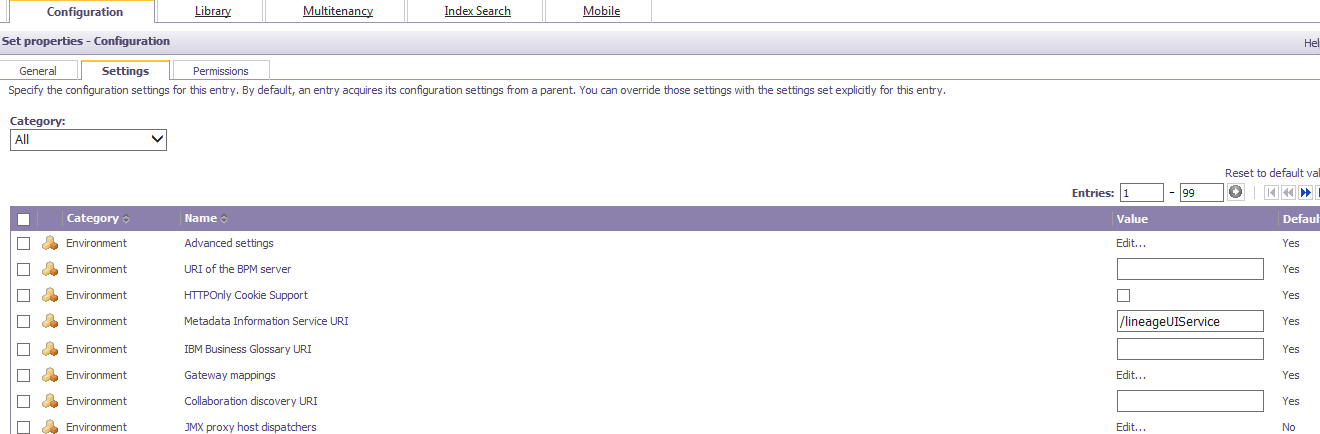
On the following screen, add the dispatchers you wish to monitor to the list.
 As a final step, if you use IBM Tivoli Monitoring or other programmatic monitoring tools,, you can capture your real-time metrics and write them to a database. The SMM includes sample database layouts, packages, and starter reports to help you with this.
Setting, capturing, and tracking your system metrics and violations over time provides you with powerful tools to monitor and manage the health of your system. With the power of the IBM Cognos analytics and reporting at your fingertips, why should the business users have all the fun?
Want to learn more about the importance of metrics for governance? Check out our recent article introducing the core concepts of Master Data Management. We’d be happy to help you develop a performance monitoring strategy. Our Business Intelligence team can get you up and running with a variety of solutions fitted to your business needs.
Links to the DeveloperWorks resources mentioned:
System Metrics:
http://www.ibm.com/DeveloperWorks/data/library/cognos/infrastructure/cognos_specific/page588.html
Installation:
http://www.ibm.com/DeveloperWorks/data/library/cognos/infrastructure/cognos_specific/page587.html
Setting Thresholds:
http://www.ibm.com/DeveloperWorks/data/library/cognos/infrastructure/cognos_specific/page589.html
Using Tivoli Directory Integrator:
http://www.ibm.com/DeveloperWorks/data/library/cognos/infrastructure/cognos_specific/page590.html