Information for All: Watson Analytics and IBM’s Self-Service Revolution
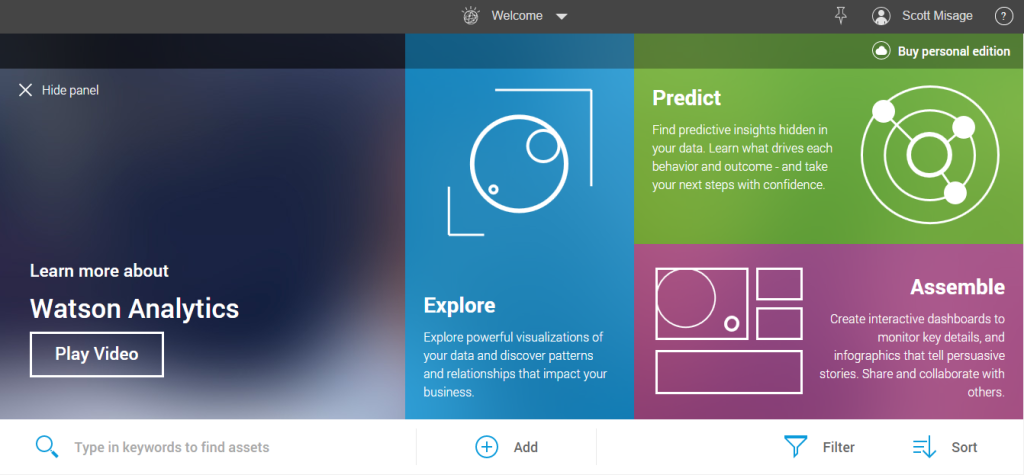
You might have missed it if you weren’t closely following the situation or already using the platform, but around the middle of last month IBM forever changed the concept of self-service analytics when they quietly moved Watson Analytics out of beta and into general availability. Watson Analytics is a new cloud-based application that enables an individual to work with their data at a level of ease and intuitiveness that we’ve not seen before. As a sibling of the IBM Watson family, it has inherited a powerful natural language processing capability and as such it enables an individual to query data not with a programming language like SQL, but in the form of a natural language dialogue.
Intelligent Design
For the past few years, Ironside has been out campaigning and sowing the seeds for the “consumerization” of the enterprise. More specifically enterprise analytics and self-service access to decision making information. We were tired of settling for the same old enterprise-looking business applications and we wanted the same usability, look, and feel of the consumer apps that we used every day. We injected user-experience (UX) and design thinking into our methodology and established an entire team within our organization that is focused on solution design and usability. We’ve brought to market exciting solutions such as AnalyticsUX that make it easy for everyone to build beautiful and usable self-contained dashboard applications with tools they already own. We championed an innovative and agile user-centric approach to modeling data and metadata for self-service consumption. We built and launched the first-of-its-kind course on applied data visualization, combining theory and applied practice into a singular workshop-style experience to empower Cognos BI users everywhere.
All the while we had also been telling anyone who would listen about an exciting new project that IBM had under wraps, which our team had also been beta testing behind the scenes. Originally dubbed Project Neo, we knew this initiative was going to change how people viewed the concept of self-service (and subsequently shed some IBM design stereotypes) and we were very excited at that prospect because it perfectly exemplified the consumerized analytics agenda for which we had been advocating and enabling within our clients. It was intuitive, worked on every device natively, was entirely cloud-based, was beautiful and pleasurable to use, and took all the guess work out of creating stunning visual analyses. With Watson Analytics, IBM didn’t just set out to emulate the competition; they fundamentally changed our expectations of how we should be interacting with quantitative information as people.
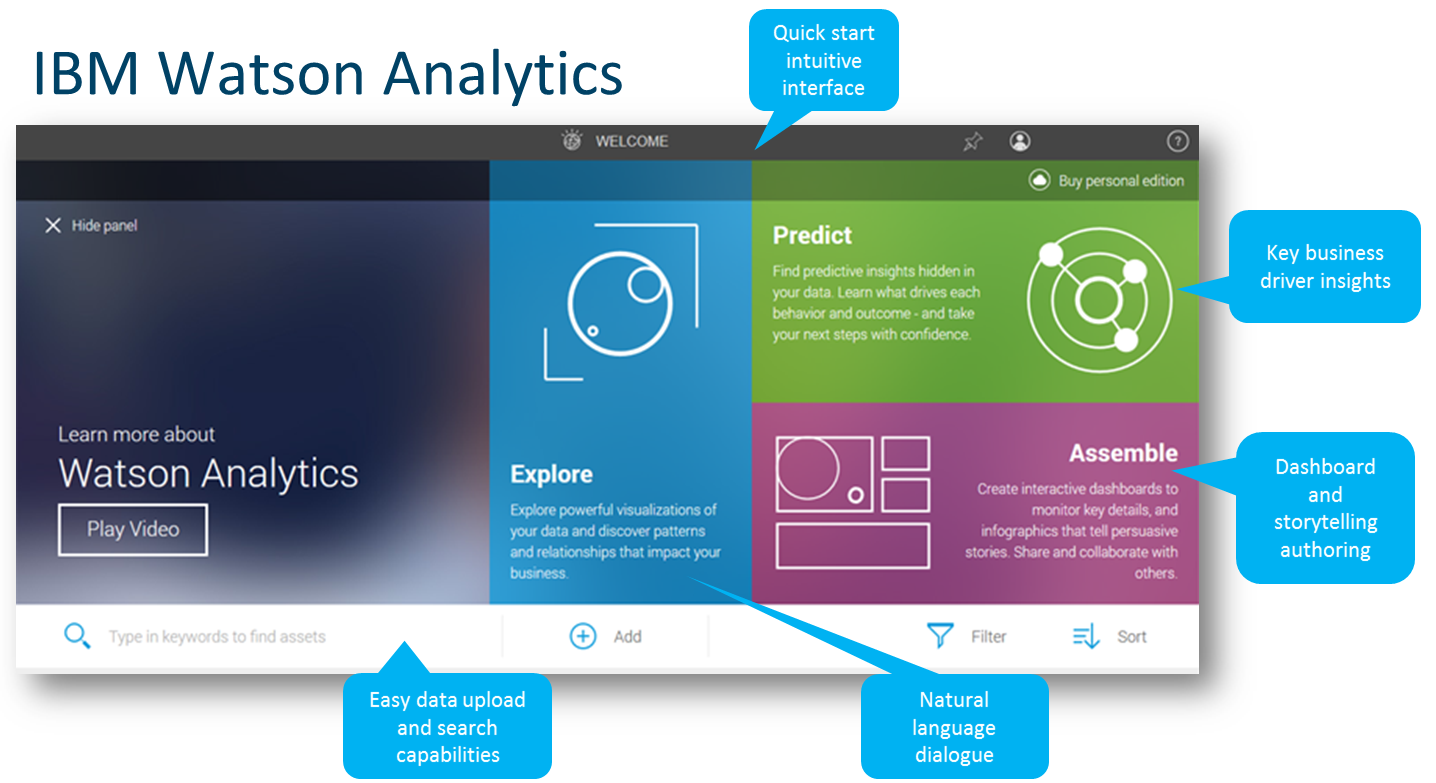
What’s most compelling about Watson Analytics is how it approaches the self-service problem holistically. That problem can be grouped into a few different facets, which are exploration and visualization, prediction, narration, and not to be overlooked, the supporting data itself (acquisition, quality, and integrity). Let’s take a look at each of these in more detail.
Understanding Your Business
“We don’t know what we don’t know.” I’ve probably heard this exact cliché uttered hundreds of times by data and analytics professionals and business users alike over the course of my career. I’m definitely guilty of using it myself on more than a few occasions. What I like most about it is that it concisely articulates the self-service data exploration problem. A classic approach to self-service that relies upon a data warehouse requires that you know exactly the types of questions you are looking to ask. This works very well for problems such as cyclical business processes that require some degree of variability in the analysis that you do.
An example scenario that would fit in this model is building a monthly financial board report where precision is paramount and the data and types of questions are well understood by everyone involved. What happens when the question you need to answer requires data that isn’t in the warehouse? Or the self-service application wasn’t designed to answer the type of question you are asking?
Cue the rise of the personal data exploration tool where technologies like Excel, Tableau, Qlikview, and Datawatch (and dozens of others in the rapidly growing sector) are well-established options that allow you to rapidly visualize new questions you didn’t originally plan on asking or explore and mash up new data sources that aren’t in the data warehouse. Unfortunately, these solutions still require that you A) understand your business, B) know the questions you intend to ask, and C) are technically savvy enough to use the tool. Enter Watson Analytics and its “explore” functionality. Where Watson Analytics differs from and truly excels over the alternatives is its ability to complement and enhance your capacity to learn when you don’t know all of the questions you should be asking.
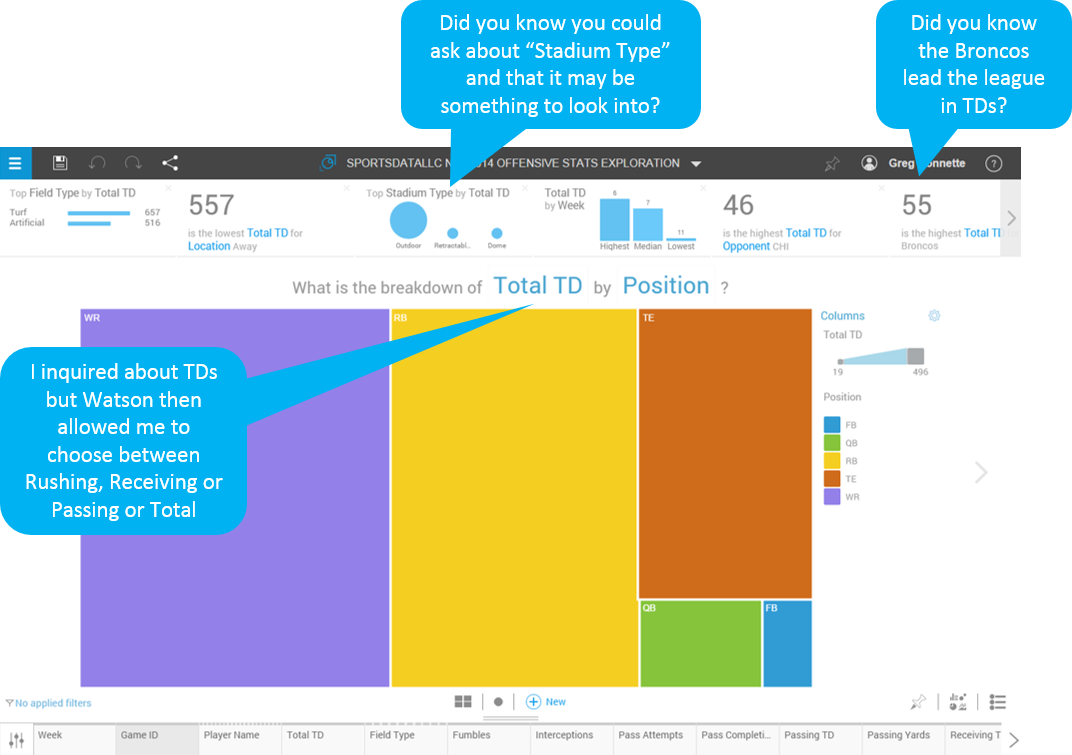
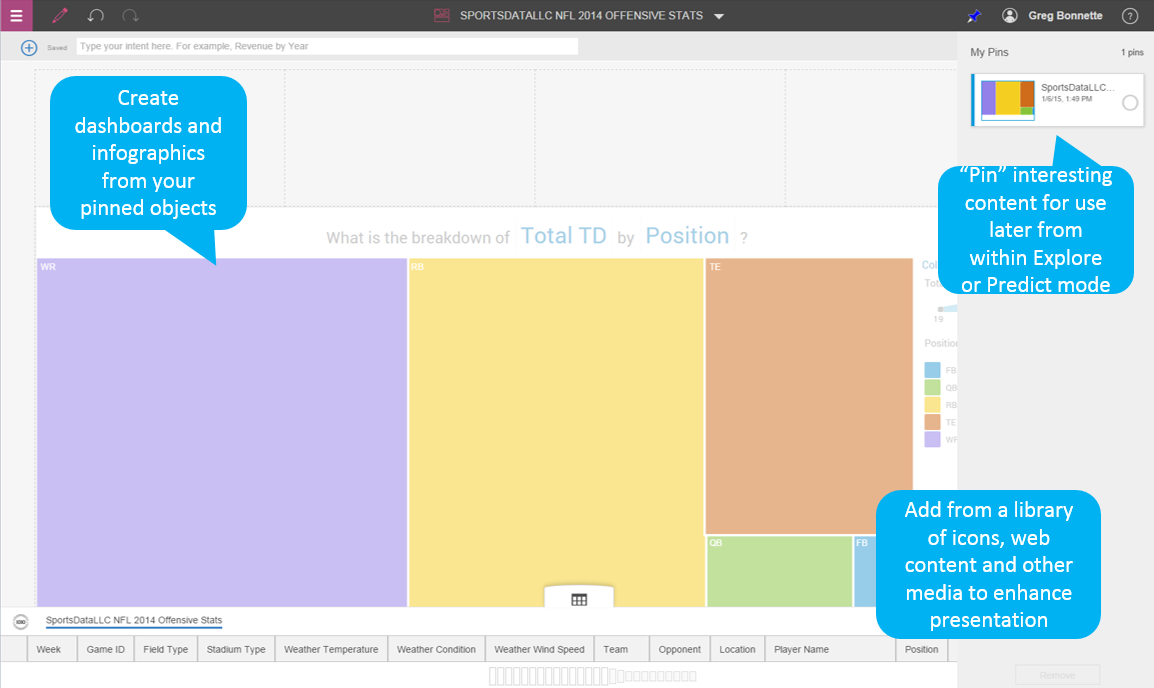
In the analysis above, I was most curious about touchdowns (TDs) by position in the NFL this season, but Watson also surfaced other statistically significant analyses from the data set that also center on touchdowns. I may have never thought to consider Stadium Type as a factor or may be new to football or this data set and have no idea I could even ask questions about Stadium Type. In addition, Watson suggested a best fit visualization for me to quickly come to the right conclusions without having to know anything about data visualization theory and the factors of human cognition. So often the success and ROI of a self-service application at a company is stymied by the individual’s knowledge about the business: what questions to ask, what supporting data is available or relevant, or how to most effectively ask those questions. It’s in this manner that the self-service exploration experience provided by Watson Analytics is so uniquely empowering on many fronts: Know what you didn’t know, increase analyst effectiveness, onboard new analysts faster, or maybe just make everyone an analyst (which is often today’s reality).
Thinking Ahead
At this stage in the game it’s safe to say that most are in agreement on the power of predictive modeling and statistics when it comes to business analytics. For many, having a predictive capability has made the transition from experimental to table stakes and has become an indispensable component of an overall data and analytics strategy. Even at Ironside we no longer distinguish advanced analytics from our other practice lines – it is simply innate to everything we do and how we think about building data and analytic solutions, from data integration to dashboards.
The classic challenge with predictive modeling for many organizations is that it’s technically inaccessible. To do it effectively it often requires a unique blend of skills that looks somewhat like a software engineer combined with a statistician and an MBA with 10+ years of experience in your industry. This is what most are calling a data scientist these days, and the challenge is that these individual resources are extremely in demand, hard to find (i.e. the purple squirrel), and expensive to hire. Organizations are overcoming the skills problem in a number of ways. One method used is dividing up responsibilities and building data science or analytics teams that are comprised of a set of complementary skills (one statistician + one subject matter expert + one software engineer = previously unobtainable data scientist). They’re also making technology and predictive concepts more accessible by leveraging tools like IBM SPSS that allow your statisticians and business experts to be more effective without the degree in software engineering. Some organizations are also supplementing by leveraging Predictive Modeling as a Service (PMaaS) in an outsourced model.
Whether you’ve found the coveted data scientist, built a multi-domain team, or are outsourcing predictive modeling, you can probably agree that it would be good for your organization if more people had access to a predictive modeling capability in some shape or form. We have almost reached a self-service boiling point with predictive analysis that is similar to that of business intelligence in the 80s and 90s before the advent of self-empowering platforms like Cognos BI. In those early days of database reporting, if you wanted to ask an ad-hoc question about your business as a business user, someone had to write you a SQL query and fetch data for you that you could load into your own spreadsheet or desktop database for further analysis. Turnaround time on such requests was often tallied in weeks instead of seconds and the lack of personnel and pervasiveness of the requisite technical skills was a major inhibitor to progress.
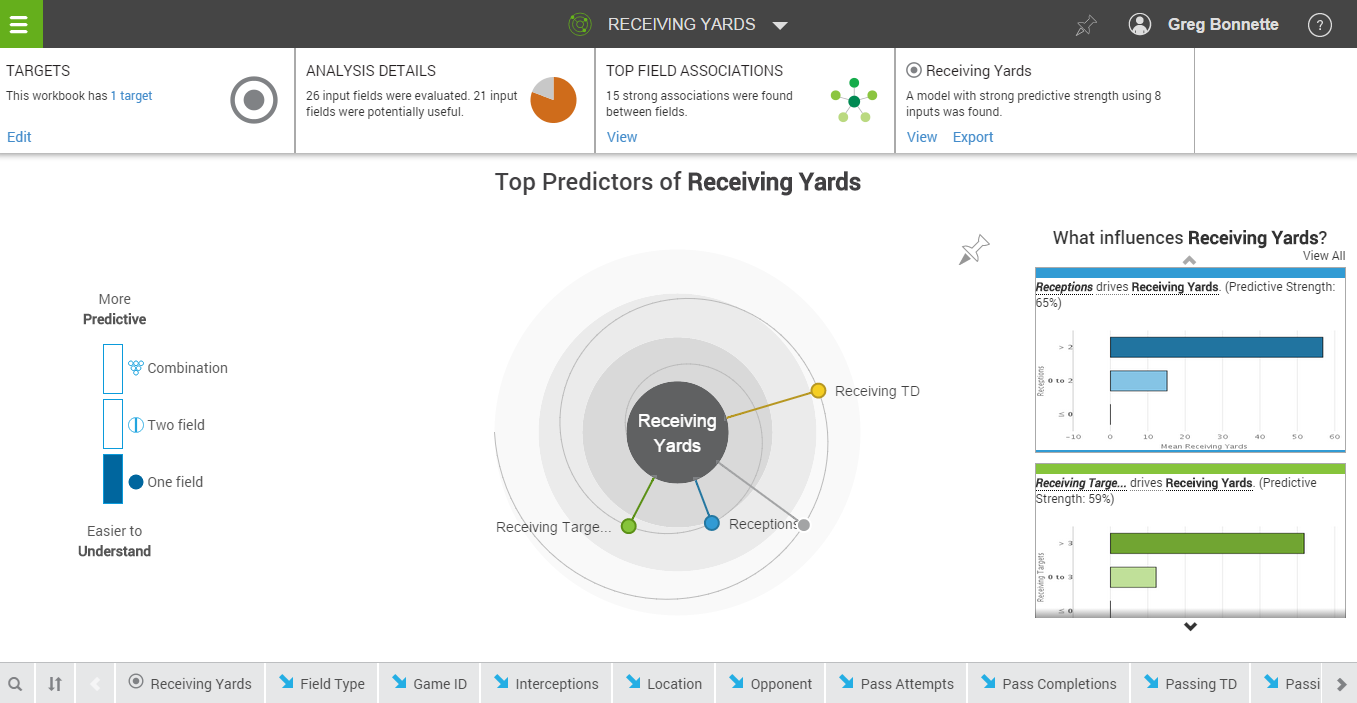
In similar fashion and up until recently, if you want to get an understanding of what the strong predictors are of an outcome you are driving (a purchase, join, up-sell, etc.) you needed to rely on someone with a strong knowledge of statistics and access to the right tools. What Watson Analytics has done with its Predict feature (which is evolved from IBM’s SPSS Catalyst product) is bring that capability to the casual business analyst in a way that is intuitive and allows one to develop a business understanding about certain findings that are presented (remember: correlation does not imply causation). There is no need to know which predictive algorithm to apply to a data set; Watson Analytics automatically selects the best fit for you.
We view this feature as not a replacement for the data science role within your organization but as an empowering capability that allows anyone to quickly find correlations and generate hypotheses that can be further evaluated and refined by those with a deeper knowledge of statistics. Watson Analytics will become an organizational feeder for all sorts of theories and analyses that can be explored further or operationalized in your data warehouse or decision automation system further downstream. Much like its siblings in the Watson Cognitive domain, Watson Analytics is well situated to enhance our natural capabilities as analysts and data scientists but not replace us all together.
Telling Your Story with Data
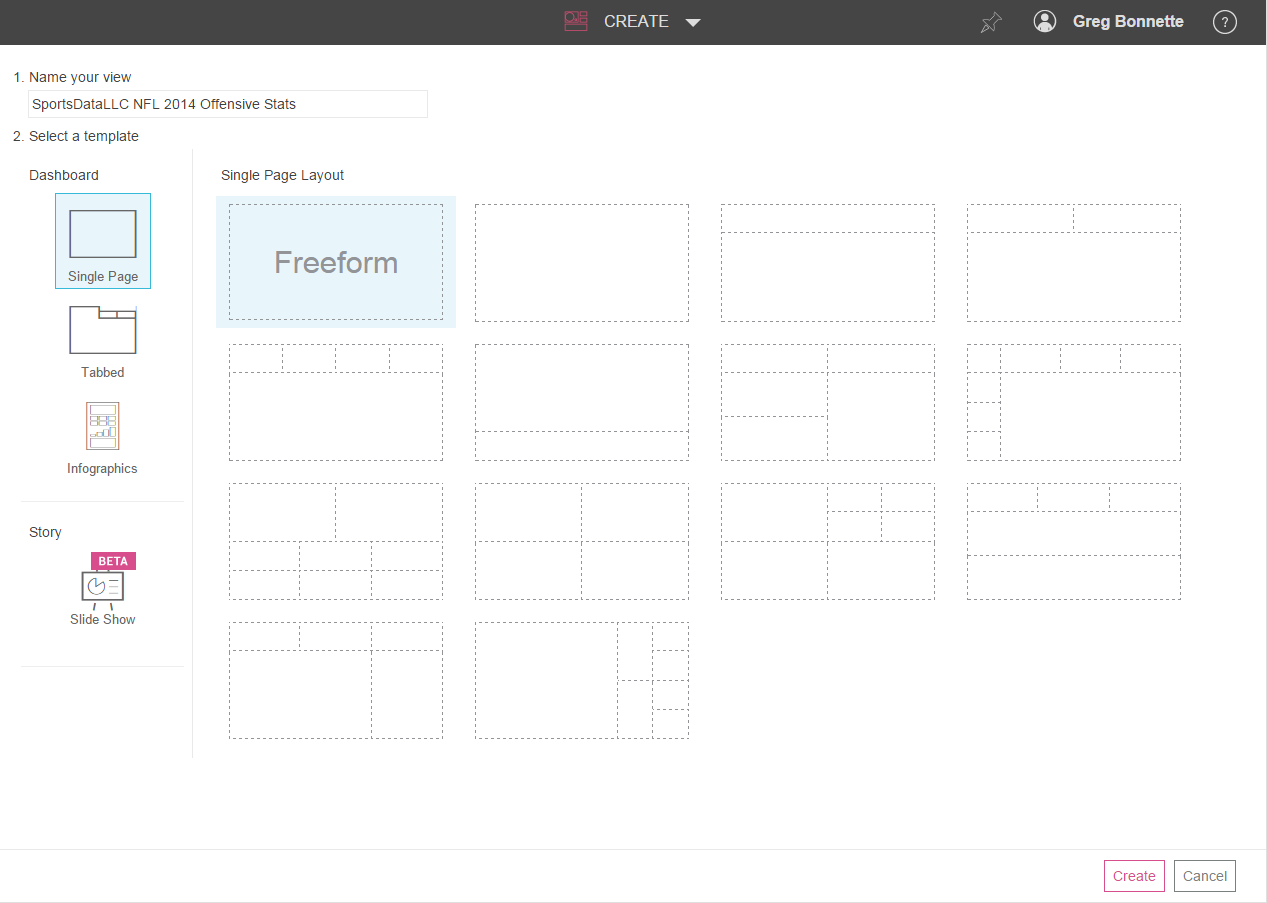 One popular anecdote that I’ve heard many times before is that “80% of your professional success is determined by your ability to communicate.” Nothing could be truer when it comes to communicating with information, and telling the right story with data can often be challenging for a variety of reasons. As stated earlier, Watson Analytics helps you always choose the best visualization, but it also makes it easy for you to create and share dashboards that allow you to narrate and annotate results along the way. You can quickly assemble infographics or presentations that dictate the story in a step-by-step fashion, similar to how you would converse with your audience when presenting your findings. Watson Analytics comes with a variety of pre-configured templates, and saving content from your exploration or predictions is as easy as pinning it to your board for sharing or re-use in a dashboard or story later on in your workflow. IBM borrowing from popular culture with concepts such as infographics and pinning are perfect examples of their new design initiative and the consumerization of the enterprise. You also don’t even need to assemble a story if you simply want to share a quick analysis. You can always export any visualization as an image or email directly from the platform at any time by clicking the share icon in either feature mode (Explore or Predict).
Starting with Better Data
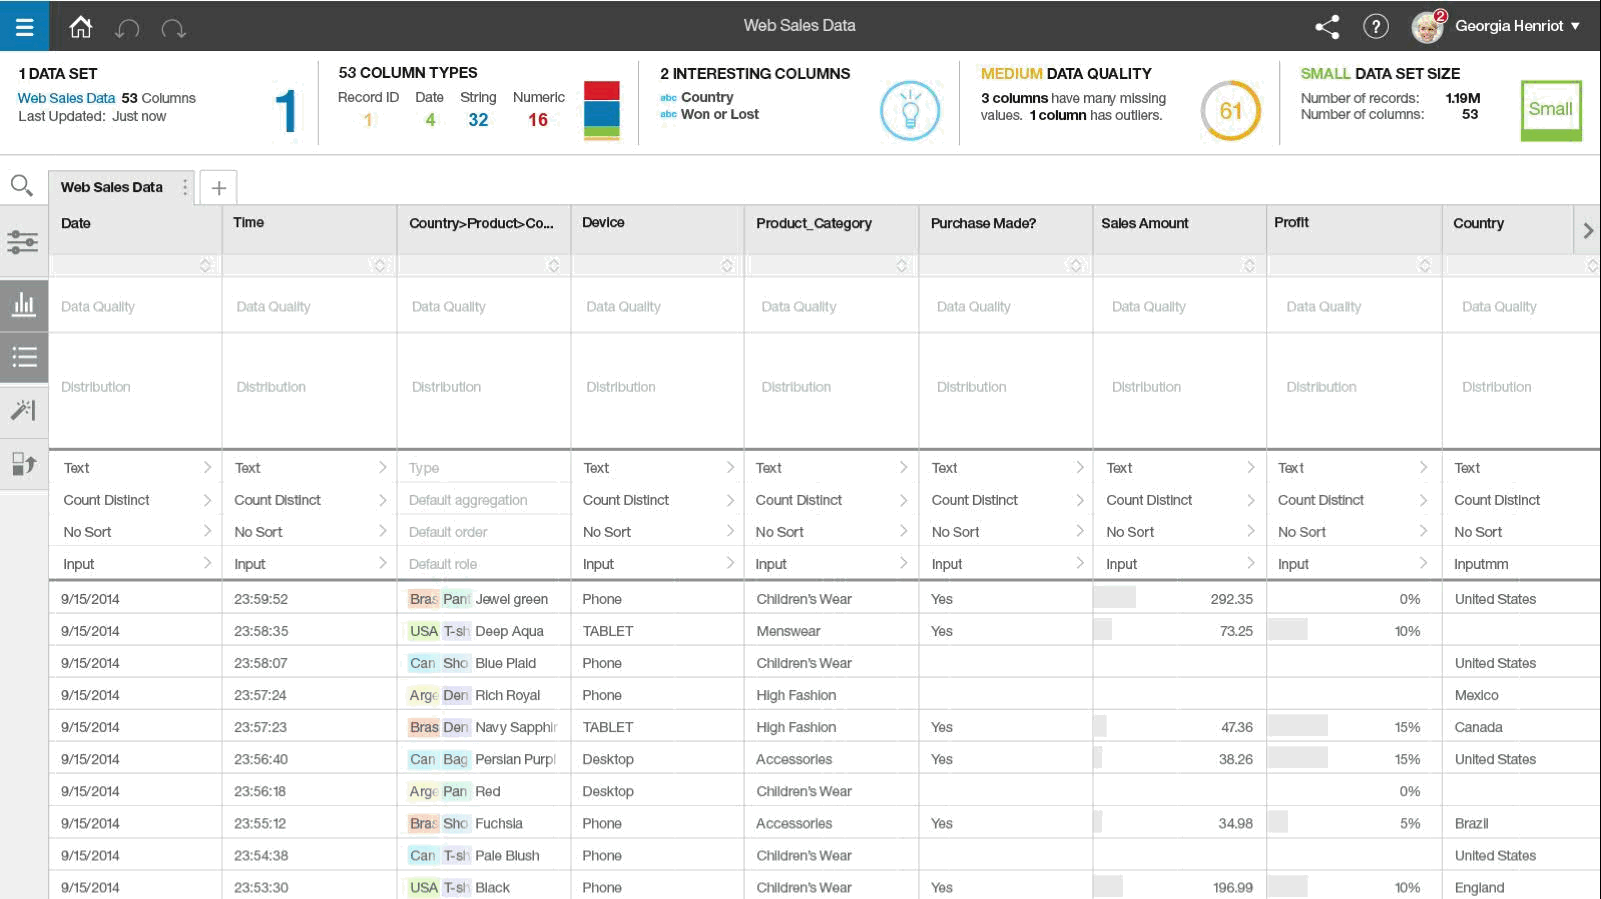
 “Garbage in, garbage out.” That’s another old saying that data professionals like to use to remind everyone that the value and sanctity of decision making information is often directly proportional to the integrity of the data that lead us to any conclusions about our business. All of the previously mentioned data exploration tools can also connect to enterprise data sources, but their real power comes from the ability to quickly load in a spreadsheet and begin visualizing and exploring the results.
This is the point at which data management professionals melt down for fear that the users they support are making business impacting decisions based upon spreadsheet data of questionable quality, age, and consistency. It’s become increasingly difficult to walk the line between business agility and data quality, but IBM Watson Analytics is tackling the problem head on and it’s the most effective approach we’ve seen to date.
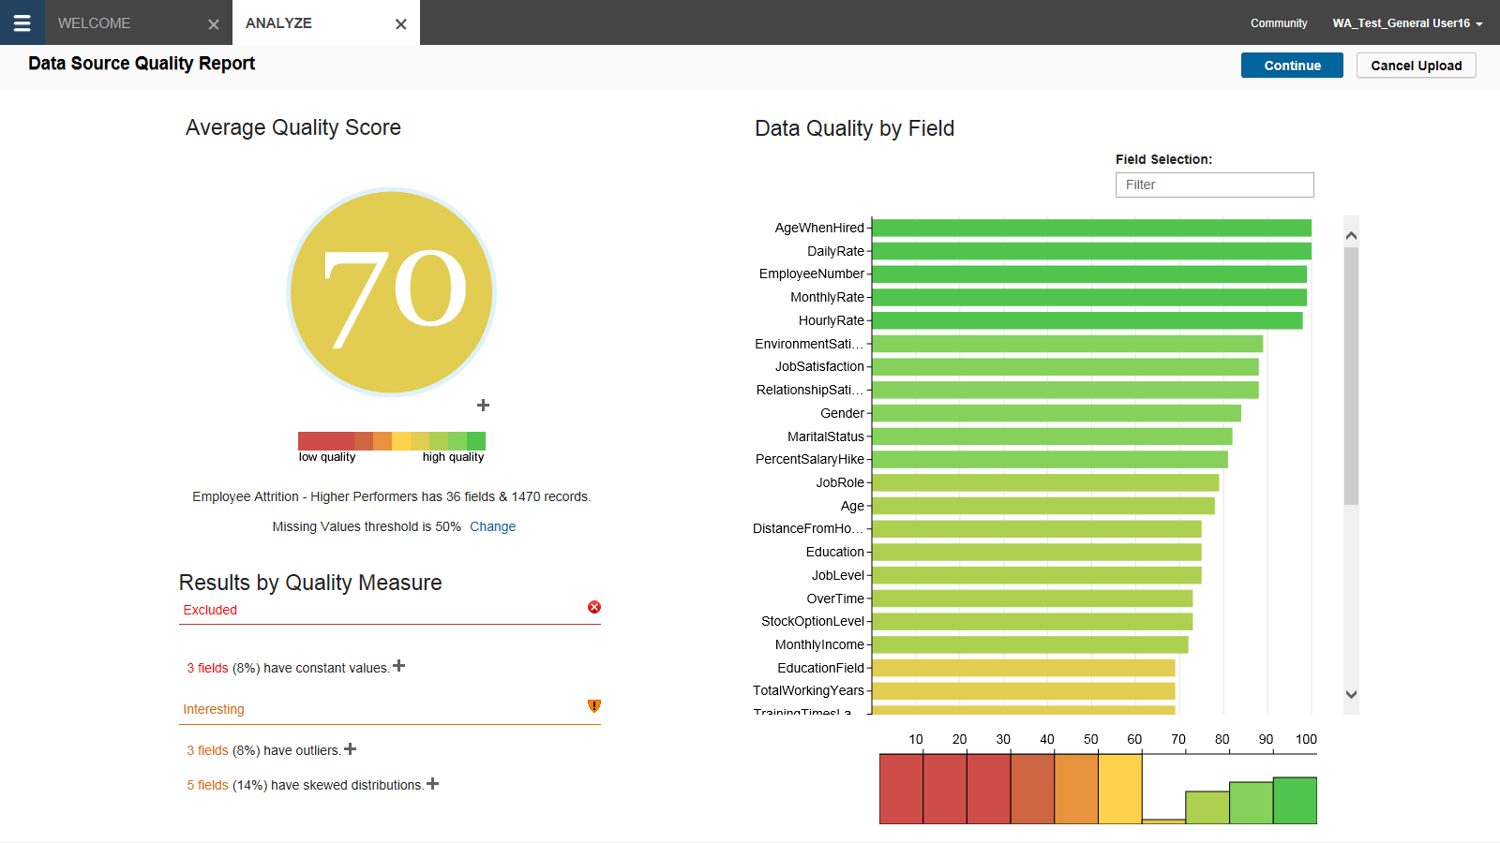
When you upload data to Watson Analytics, it immediately provides you with a quality score and highlights problem fields that need to be addressed. What’s more is that it will also prevent you from coming to conclusions about your business based upon unscrupulous data by disallowing you from doing predictions upon fields in your data set that don’t meet minimum standards for quality.
A new feature in the works for Watson Analytics introduces the concept of data shaping, which is essentially a self-service means of data cleansing where a user can make tweaks to a data set and see their data quality score improve in real time. Below is an example of what that interface could look like in the near future.*
While nothing has been officially announced, we already see placeholders in Watson Analytics for live data source connections and it seems only natural that we would be able to eventually import directly from Cognos BI metadata as well. We’re betting on IBM’s cloud-based data warehouse DashDB, and also Cloudant NoSQL by extension, as one of the first available systems for doing this.*
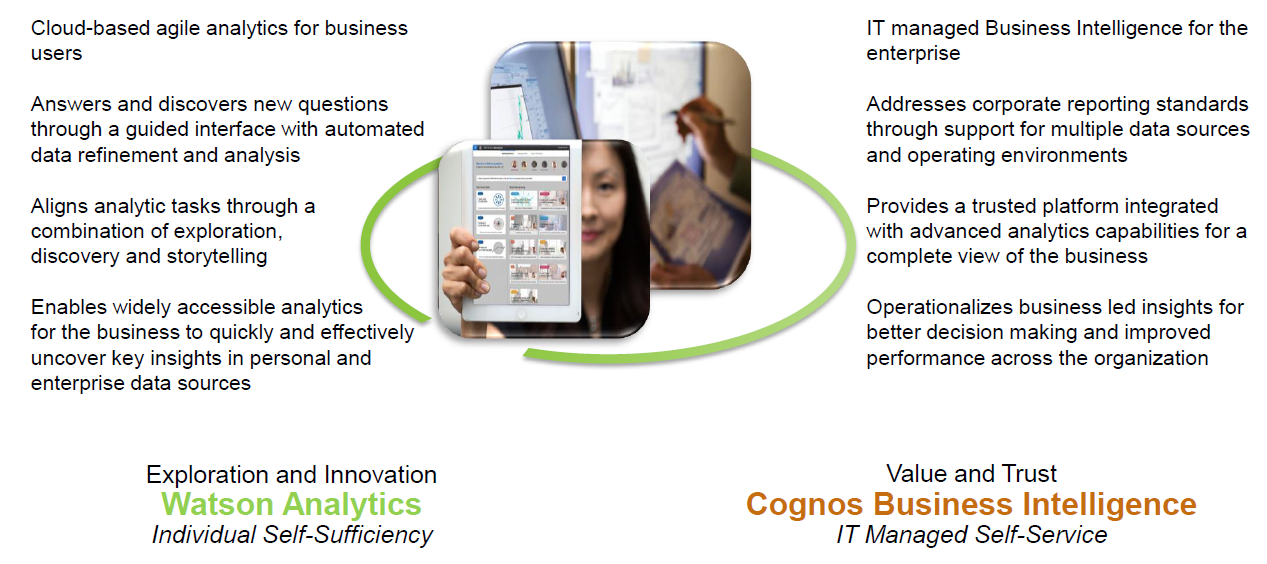
Watson Analytics and Cognos BI
Many of you are probably asking yourselves right now, “How does this work with my existing BI tools like IBM Cognos?” We view the answer to that question to be similar to the model we described earlier where the self-service predict function is a feeder for the data science function. Watson Analytics as a whole becomes a feeder for operationalized analytics at your organization. Lightweight analyses and concepts that are rapidly developed or uncovered by the masses using Watson Analytics can be fed into the enterprise to become part of an everyday process.
For example, a business user might uncover some interesting correlations using Watson Analytics, which leads to a more rigorous customer segmentation exercise within the data science team where new customer groupings are established. Those new segments have a great deal of analytical value, and their criteria is then built into the data warehouse and the customer master data so that all areas of the organization can aggregate data or analyze customer profitability in this manner. These new segments uncovered in Watson Analytics even find their way into standardized management reporting for shareholders or the executive team. In addition, we anticipate there to be a variety of technical integration points between Watson Analytics and Cognos BI in the future that only increases the value of both platforms.*
Is the Enterprise Ready for 100% Cloud-Based Analytics?
Consider a few points as you begin building the case for Watson Analytics and a move to cloud-based analytics at your organization in general.
- Watson Analytics is hosted on IBM SoftLayer. Ironside has been partnered with IBM SoftLayer as their premier analytics infrastructure provider for Ironside Managed and Hosted Business Analytics. We have many happy and secure customers on this platform, which has some of the most stringent information security requirements in the industry. It is also likely, if not certain, that customers will be able to provision their own fully isolated private cloud instances of Watson Analytics to meet a variety of security requirements or budgetary constraints.*
- The vast majority of organizations have moved or are already moving corporate data to the cloud. We largely have Salesforce.com to thank for establishing this precedent as their CRM suite is nothing short of pervasive within our large Fortune 500 client base.
- All of the positive design elements that have been described are the benefit of having a 100% cloud-only approach for the development of Watson Analytics. By being able to capture usage statistics through the beta program or anonymous usage monitoring, the Watson Analytics team is able to rapidly refine the application and improve its usability based on how people are actually using it. This is user-centric design 101 and is essential to realizing the consumerized enterprise. If the application were to be on-premise only at this point, none of that would have been possible, nor would customers benefit from the concept of continuous integration that is possible with a cloud/SaaS application.
Sign Up Today
If you would like to start using Watson Analytics today, simply head over to WatsonAnalytics.com and sign up for your free account. For consultation around integrating Watson Analytics into your broader data & analytics strategy, jump-start services or any questions you may have, please contact us at GetInsights@ironsidegroup.com.
*These statements represent Ironside’s unique forward-looking perspective. They do not reflect IBM’s official position with respect to the product or its roadmap.