Beyond Market Basket Analysis: Extending Association Rules

Do you ever wonder how Netflix makes recommendations for you? Or how the drug store decides which coupons to offer you when you make a purchase? Behind the scenes they have a data scientist conducting what is called market basket analysis, which searches through vast amounts of purchase history information to find patterns in people’s purchases, web searches, or Netflix viewing preferences. The data mining technique used for market basket analysis is called Association Rules (AR). This is the actual algorithm designed to detect probabilistic if- then statements, such as “If you watched Breaking Bad and House of Cards, then you are also likely to enjoy Mad Men.”
AR is a powerful technique that can search through very large sets of seemingly random data to identify various types of patterns. However, it’s tied so closely to market basket analysis that sometimes the two terms are used interchangeably, meaning AR sometimes doesn’t get considered for other types of analysis where it could be useful. AR may also be left on the side because, thanks to the modern analytics mindset of “go big or go home”, people are looking for the newest, flashiest, most complex solution on the market, and AR is actually very simple mathematically. Contrary to popular belief, though, there’s nothing wrong with investing in a straightforward solution. In fact, they should typically be favored over more complex solutions if possible. Consider these alternative applications for AR beyond market basket analysis.
- Fraud Detection: By isolating a specific consequent of a pattern, such as a fraudulent insurance claim, AR will search through many factors related to the individual, the claim, and the incident to find patterns that occur when a claim has been fraudulent in the past.
- Identification of High Risk Patients: Using a similar approach, you could find patients at risk of adverse events, such as a heart attack or stroke, based on their previous health information and prior diagnoses.
- Classification: Biologists often use AR to classify plants or animals based on the presence or absence of specific characteristics. This approach could be applied to a number of classification problems. One example commonly used in demonstrations is classifying survivers of the Titanic.
- Data/Dimension Reduction: Recently I turned to AR as a data reduction tool for a large set of strictly binary data. Classic data reduction techniques, such as principle components analysis, aren’t approapriate to use with binary data. AR can be a simple solution to finding underlying dimensions.
- Web or Email Filter: AR rule sets can be applied to incoming emails to sort spam from important messages.
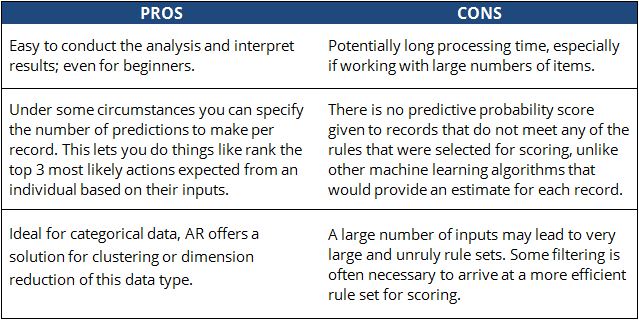
As with any analysis, there are pros and cons to using AR:
Conducting Association Rules Analysis Using IBM SPSS Modeler
Not only is AR simple to understand as an algorithm, it is simple to apply and evaluate. AR can be performed in most standard tools (i.e., SAS, R). IBM SPSS Modeler offers some unique advantages:
- Visual, easy-to-use interface allows non-data scientists with technical skills access to data mining techniques, such as AR
- Multiple algorithms available for A R-based data mining
- Ability to apply AR to transactional or tabular formatted data
- If tabular format is preferred, the set to flag or restructure nodes offer an easy way to format data properly
- Abilty to filter resulting rules by confidence, support, lift, or specific inputs
- Expert settings can be applied to account for imbalanced data or rare events
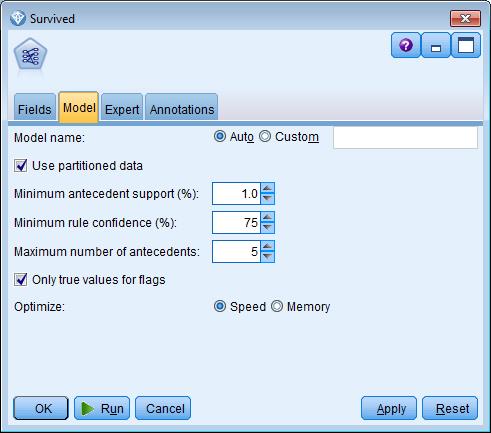
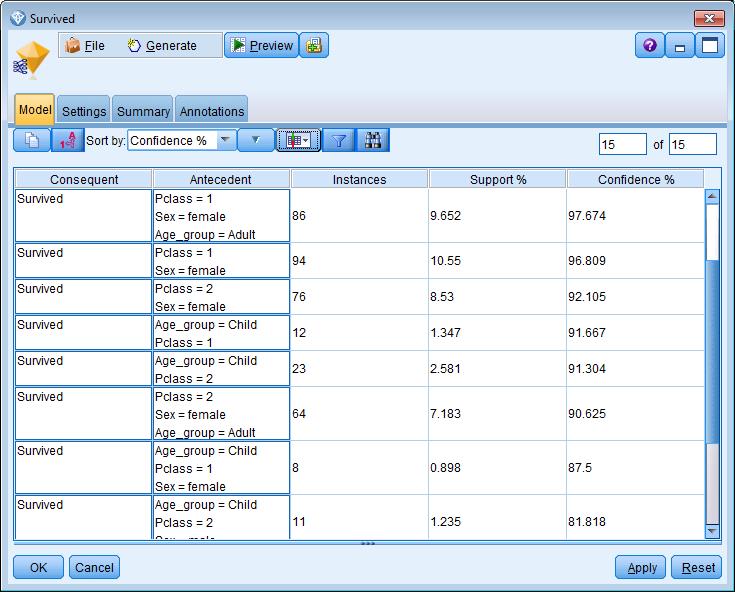
Below are some quick examples showing what the Titanic data set mentioned earlier looks like in Modeler.