5 Compelling SPM Dashboard Creation Tips: SPM Journey Part 3

“Content is King” is a phrase made most famous by Bill Gates in a 1996 essay, but it’s been used many times before. I believe he was referring to what will drive the internet for years to come. In my mind, this saying was and is still true in media. Just take a look at Netflix, Amazon, YouTube, and other organizations creating original content. You can even go further outward and consider any social media platform and all original (or shared) content in a company’s data stores.
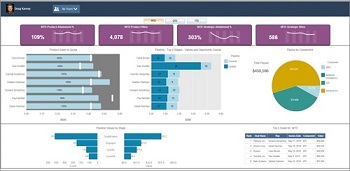
So what does any of this have to do with a Sales Performance Management (SPM) dashboard? Everything! You can fill a whole screen with information – including words, values, tables and a variety of visuals – that gives you at-a-glance access to all the content critical to sales success. You can also emphasize the most important elements by doing things like moving a Key Performance Indicator (KPI) to the top of the page, adding conditional formatting, or changing/adding a visual. Today I’m going to discuss this content, not the user interface (UI) or user experience (UX). Both are crucial aspects of a compelling SPM dashboard, but understanding what content you need is the first step.

SPM dashboards have limited screen real estate and limited time to capture a person’s attention. Add a stereotypical salesperson into the mix and the dashboard needs to be compelling within seconds. The dashboard’s purpose and priorities must be readily apparent in order for it to be successful. In fact, based on the 2015 CSO Insights Sales Management Optimization study, “only a quarter of sales managers have leveraged or planned to leverage sales analytics. This data highlights the opportunity for sales operations to provide sales professionals with a selling advantage through analytics .”
Let’s take a look at 5 of the things that will be important to the salespeople using an SPM dashboard. With these elements highlighted, you’ll be able to establish data-driven sales practices at your organization.
1. Performance Metrics
Performance specifically relates to the results impacting a salesperson’s incentive compensation. Sales people commonly receive results in the form of sales dollar amounts or widgets sold. The next step in reporting would be to compare these results to a quota or target. With these elements together, we get one of the most common SPM KPIs: Attainment Percentage. The point of displaying an attainment percentage is that it achieves what displaying sales and quota would achieve in a more streamlined way.
If I get paid based on my level of attainment, this would be a KPI for me. Some other related questions might be what tier of payout my attainment percentage achieves or whether or not I’m in accelerators. There are a variety of facts that can be helpful in addressing these questions:
- New customers – Ratio of new customers vs. all customers or rate of new customer increase
- Period over period comparisons
- Percentage of discount or rebated sales against total sales
The best performance metrics can be traced to an individual’s compensation plan and then directly back to the company strategy, letting each person know the minute they view their SPM dashboard the kind of impact they can have on their organization’s goals and the actions they can take to make that happen.
2. Variable Compensation

For a company, SPM dashboards are done to increase the bottom line through stronger sales numbers. While a company may work hard so everyone is focused on the same vision or mission, however, sales people always want to know what they are getting paid. Whether you are a hunter or a farmer, compensation plays a large role in driving day-to-day activity. We recommend at the least including the latest payout amount or if possible the current period amount and adding additional detail if the circumstance calls for it. This is the individual’s bottom line, and it will help them direct their energy effectively.
3. CRM Integration
Customer Relationship Management (CRM), in the SPM context, is all about managing prospects and sometimes existing customers. This is a broad category. Consider that an integrated and fully utilized CRM system can become the system of record for sales. Pipeline, interactions, actual sales, customer demographics, and many other attributes from a CRM can all be included in an SPM dashboard. Basic dashboard elements can include quantity and value of various stages of a pipeline. To make a dashboard compelling, go a step further and include KPI’s like:
- Closing rate – 30% of Pipeline is closes of qualified leads
- Sales cycle time – 73 days to close once a lead is qualified
- Pipeline to quota ratio – 150% of quota in pipeline, 70% from Best Few
- Growth or decline – Pipeline value increased by 15% last month
Presenting this kind of data lets the sales force keep track of both what they’ve accomplished already and what they’re trying to accomplish in one location.
4. Advanced Analytics
“Advanced analytics” refers to a predictive solution. Predictive content provides statistical information to identify future behavior, specifically by isolating one or more variables. Integration of SPM dashboards with predictive models allows salespeople and managers to make more informed decisions without just relying on gut instinct. I have spoken to many managers who allocate their pool funding based on educated guesses and experience. Experience is always important, but I’ve found my educated guesses and gut feel aren’t always right. Some useful predictive analytics you can include are:
- Prospect scoring
- Attainment or achievement
- Next best action
This information adds a future element alongside the past and present, which gives your salespeople a leg up on what’s coming down the road.
5. Company- and Industry-Specific Data
Every organization is different and most industries have their own needs. In some cases a widget is sold and the salesperson is done. In others they follow the process through to delivery or implementation, more like relationship managers. This means there may not be a one-size-fits-all answer for your company. The simplest option for targeting a dashboard to your sales environment is to provide salespeople a top 5, 10, or X list showing key metrics that need immediate attention, such as:
- Recently closed or completed – What I will be paid on
- Unrealized deals – Who I need to work with to get my deals funded and paid
- Process issues – Deals I signed, but are stuck in the process: crediting, setup, etc.
- Renewals – Customers I need to re-sign
These are just a few examples of items that might be useful in your context. To discover these, you can also interview the sales organization directly as you design your dashboards to see what information would be most useful.
SPM Dashboard Next Steps
With these key data areas covered, you’re ready to discover, analyze, design, and build your SPM dashboard. Remember, the most important aspect of the dashboard is always that the information provided leads to an actionable result. Consider the top 5 content list provided and design with the action in mind. Below are some sample actionable items to get you started:
- Performance – I have too few new customers, so I am not getting my accelerator
- Compensation – I have not hit my new logo bonus, which means no family vacation
- CRM – My pipeline is growing with new prospects, so I should close them to hit the accelerator
- Advanced Analytics – I should focus on the new logos that have the best prospect score
- Specifics – New customers are getting trapped in crediting, how can I help?
All of these insights make the salesperson consider their next steps and actions, leading to more productive choices on a daily basis.
If you’d like Ironside to help you get an SPM dashboard strategy in place for your organization, check out our IronDrive solution. We can help you quickly and easily transform your sales data into consumable visual insights.
Be sure to check out the other articles in this SPM series:
- Crafting an Individual Performance Report: The SPM Journey Part 2
- 3 Ways to Focus Your ICM Reporting: The SPM Journey Part 1

References
- Chamberlain, Tom. Sales Operations Strategic Issues 2016 – Part 1. CSO Insights. December 18,2015.