5 Ways to Drive Analytics Adoption: Engage Your Organization

Let’s go back a few years. You and your company invested significant amounts of time, effort, and capital to implement a business intelligence environment meant to serve the analytic needs of your organization and help drive insights. You and your team spent extra effort in developing the metadata and reporting that the business said they required, yet you’ve been hearing about users downloading free tools for analysis, your development request backlog has dried up, and a quick look at your audit logs shows flat, or worse, declining usage of your environment. What’s going on?
You may have an analytics adoption problem, or even more concerning a deeper analytics adoption issue where company analytics use is growing, but not through the BI environment you support.
This article will outline some approaches you can take to help turn the tide.
1. Focus on Ease of Use
One of the many reasons that users turn away from enterprise BI environments is that consuming and authoring reports can be quite challenging. Have you organized your content in a way that guides the user community towards the content they seek? Typical approaches here are to align data functionally, or by subject matter, or to leverage shortcuts to serve both taxonomies and avoid having to duplicate reports and content.
Additionally, if the platform you are using is enabled with search functionality, make sure you are taking advantage of it. Many tools will index key information including report names and descriptions, but also metadata elements within reporting objects. Make the effort to ensure these features are set up appropriately, and that your indexes are up to date so that current content is easy to find.
For standardized reports, make sure that it’s an intuitive experience. Institutional knowledge shouldn’t necessarily be a prerequisite for correctly consuming a report, and there shouldn’t be a list of “tricks” necessary to derive accurate information. If users don’t have to think about the steps required to consume a report, your analytics adoption rates will grow.
2. Improve Your Metadata
One of the most frequent complaints we hear from users in our Analytics Advisory engagements is that the promise of self-service often fails to meet their high expectations. This generally isn’t about the tool being used, but instead focuses on the metadata, or the semantic layer.
These semantic layers seek to hide the complexities of underlying data sources and data relationships from the user community, ideally offering an intuitive, “business readable” authoring experience where the key measures and dimensional contexts are easy to find and understand with information about sources, definitions, and usage just a click away.
Does this describe your metadata? If not, consider taking advantage of enhancement functionality to make the process of self-service authoring a more rewarding experience for your user community. Many of the enterprise BI platforms available today provide a means for generating a business glossary and lineage details to be integrated into your environment and made available with simple user gestures.
If you fail to make the process of authoring or consuming analytics content intuitive for your end users, they’ll either stop using your environment or start exporting massive amounts of content to create their own local “spreadmarts.” If your environment can’t provide the user community with what they require to make decisions, they’ll act without you….they’ll find a way to get what they need outside the system you created.
3. Foster User Engagement
Key to the long term ROI of your organization’s investment in an analytics platform is continued user outreach. If you stand up an environment, a well-defined metadata model, and a set of standard reports and consider the job done, you’ll eventually see the signs of slipping analytics adoption.
Business needs and the decision making process required to support them constantly change. Make sure you are keeping pace with this change, adapting your metadata, and reporting as necessary. You can achieve this by identifying analysts, technical-leaning resources, and data subject matter experts in the business. Leveraging relationships with these resources is your best path to understanding how the business community and its analytics needs are changing.
In addition to regular meetings with the business users mentioned above, you’ll want to engage in user outreach in other ways, including training and awareness. The incidence of Microsoft Excel skills in your user community is generally going to be higher than that of the specific brand and version of business intelligence you’ve deployed. As such, it shouldn’t come as a surprise that, upon hitting enough bumps on the road to BI tool mastery, your users revert to flat file outputs and local spreadsheets for analytics. To help reduce the frequency of this type of user behavior (and avoid the challenges it presents to data veracity), it’s important that users are enabled to support their learning journey.
Standard classroom-style training and enablement should be reinforced with simplified instruction delivered in easily consumable forms; think quick videos posted to your Intranet that, in 3 minutes or less, show the user how to consume, schedule, or adapt standard reports, how to navigate around your BI environment, how to search for content, etc.
Additionally, holding regular “data training” sessions to assist new, casual, and lapsed users in understanding where to find specific data in your semantic layer or metadata, how to understand what the data represents, where it comes from, etc. will go a long way. Those same business-embedded resources mentioned above could even run these trainings in some cases.
In terms of making sure your analytics environment keeps pace with the needs of the business community in your organization, it’s important to be sure to time box your development and release initiatives and aim for a regular cadence of analytic value delivery. Marketing your value delivery is critically important as well; leveraging announcements via email, Intranet sites, etc. to build and maintain awareness of the value of what your Analytics environment is delivering, and the hard work that you and your team are doing.
4. Monitor and Measure
Sometimes, it’s too much to expect that your user community will help you understand where they find value in your analytics environment and where they don’t. User outreach, as mentioned above, helps, but there’s more you can do.
Most enterprise BI tools offer auditing with feature sets that range from simply understanding which reports were consumed by who to full-on details about the ad-hoc queries executed. Take advantage of this data to understand what content is popular, and with which functional areas of your organization. Once you understand these metrics, ask why. This conversation typically allows you to understand use cases and underlying needs that you can build on for better business outcomes in the form of new reports, dashboards, or other content, which of course leads to stronger analytics adoption.
At a more basic level, it’s helpful for you to understand the health of your analytics environment. Where are errors occurring? How does report execution time compare to historical benchmarks? Is it shorter or longer than before? Why? Are logins up or down this quarter? Why?
A useful approach here would be to develop your own analytics operational dashboard based on your audit data, potentially also combined with organizational/functional data, to understand patterns of usage from multiple perspectives.
5. Embrace Mode 2
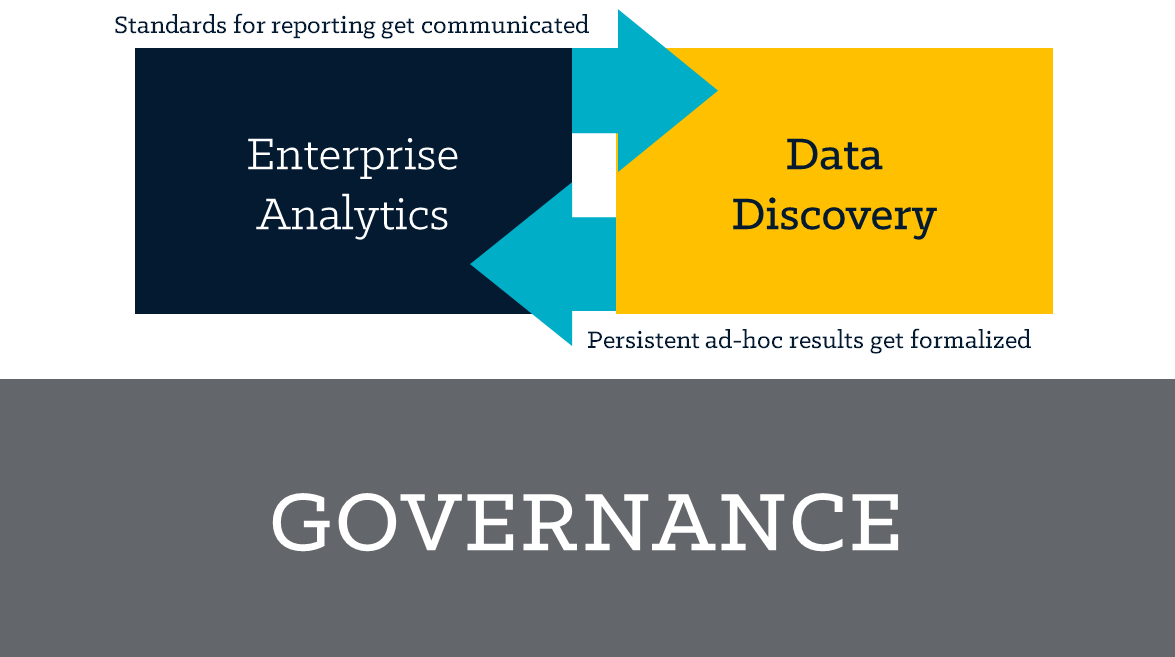
Finally, given the rise of data discovery, or “mode 2” analytics in Gartner parlance, it’s important for you to consider this functionality and understand how it best fits into your analytics ecosystem. The most important thing to remember as you figure out where mode 2 analytics fit in your organization is that the most effective approaches are balanced. They blend traditional enterprise analytics methods with new mode 2 and data discovery oriented ones. This kind of solution is what’s called bimodal analytics.
Several clients we have worked with in the recent past have taken the approach of implementing a “data workshop” of sorts to start heading toward a balanced, bimodal way of doing things.
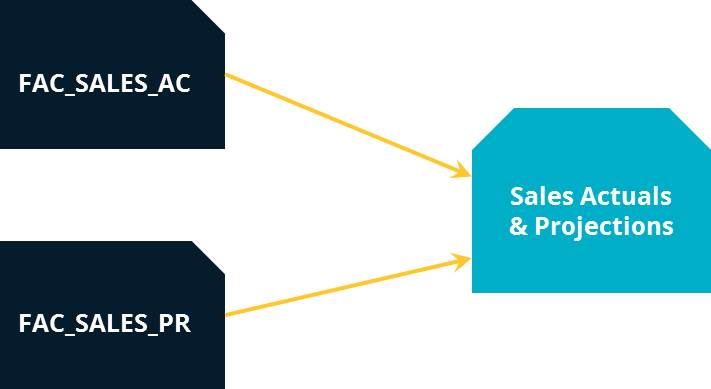
These “data workshops” create a place where analysts and data subject matter experts can, in a fully supported and sanctioned environment, explore new data sets for new insights. Should this exploration and discovery deliver new business value, these new data sets can be merged with existing sources and become part of the standard, well-governed and supported enterprise offering. This approach forms the core of a truly bimodal analytics environment where users are consistently engaged in using and improving the tools available.
Conclusion: Making Analytics Adoption Real
It’s great to have some ideas and starting points around analytics adoption, but how do you get a plan going to make it actually happen? Well, that’s where Ironside can help. Our Analytics Advisory team will immerse themselves in your business analytics needs and work with you to create a roadmap that gets you and your users where you want to be. Let us know how we can help!

About Ironside
Ironside was founded in 1999 as an enterprise data and analytics solution provider and system integrator. Our clients hire us to acquire, enrich and measure their data so they can make smarter, better decisions about their business. No matter your industry or specific business challenges, Ironside has the experience, perspective and agility to help transform your analytic environment.