Building Your Data & Analytics Roadmap One Use Case at a Time

IT and business leaders share a common goal – to leverage the data available to them in order to make more informed business decisions. The first step to achieving that goal is to create a data & analytics roadmap, a task many companies find daunting. Where do you begin?
“Most organizations are ineffective in communicating data & analytics-related concepts across departments, resulting in suboptimal management and utilization of information.”
– Doug Laney, Gartner Blog Network
Use Case: We Need It Tomorrow
You can learn a lot about an organization’s analytic capabilities by observing how ad hoc requests from the executive team are handled. For example, the finance team at an investment company recently received a last-minute request to recommend pricing for a new mutual fund product launching ASAP. The team’s VP, Staci, was expected to present her recommendations at a meeting with the CEO the next day.
From a strategy perspective, this company has traditionally been known as an active fund manager with particular expertise in U.S. domestic equity. Recently they have been struggling with the shift to low-fee index funds, which have been outperforming their active funds. The new product is a “smart beta” offering that blends the company’s domestic equity expertise with many of the benefits offered by index funds.
Inevitably, the team had to scramble for relevant information due to the last-minute nature of the request. The company’s fund pricing is pulled from their enterprise BI tool; competitor fund pricing is sourced from a Lipper feed; and sales forecasting is performed in Excel. Everything is then assembled in a PowerPoint deck. Familiar with this process, Staci finds herself wondering (as she has before), “Why did we spend all this money on Tableau and Cognos upgrades last year?”
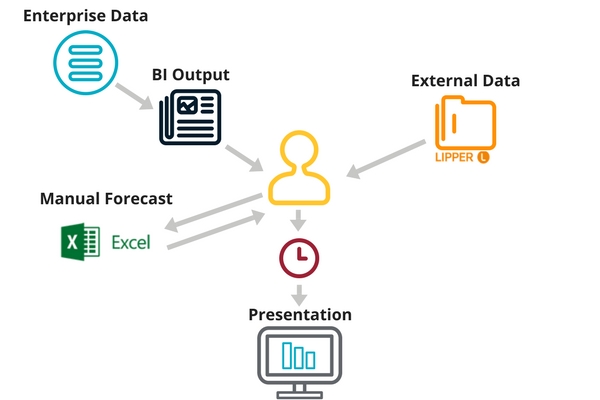
That moment highlights how a properly deployed data discovery solution could have greatly decreased the time and effort Staci spent on this analysis, boosting her ability to quickly dive into detail when needed.
How Use Cases Help Create an Effective, Actionable Roadmap
This scenario is just one example of how Ironside leverages use cases to create tangible, actionable roadmaps. For the company described above, this use case-based approach helps answer critical questions: What needs to happen for the finance team to be able to deliver promptly and efficiently on pricing analytics requests? What other teams might be having similar challenges, and could they also benefit from an improvement in pricing analytics?
Helping our clients understand their current state, while comparing it to a desired and realistic future state, has proven to be a very effective method for building a data & analytics roadmap. To jump-start this process, Ironside has created a proven framework for assessing an organization’s data & analytics maturity. Developing an understanding of where your company is in each of six key areas is a critical first step in mapping your way forward.
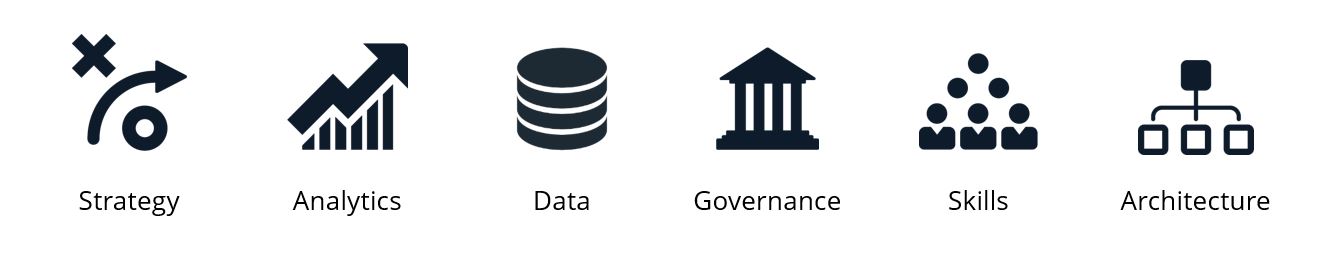
- Strategy: A disciplined process of developing and managing long-term business objectives, including the actions that help achieve those objectives.
- Analytics: Effective consumption of enterprise and ad hoc information with tools that are capability-aligned to analytic use cases.
- Data: An organization’s ability to capture, transform, and enrich data assets, including documentation and maintenance of standardized definitions for master data, rules, entities, and references.
- Governance: Ensuring the ongoing relevance, flexibility, and accuracy of data, and developing application and analytic solutions that fit the company’s unique needs, culture, and use cases.
- Skills: An organization’s collective expertise around supporting the full lifecycle of data & analytics delivery, including data architecture, data integration, project management, business analysis, data science, user experience, and training.
- Architecture: Alignment of systems and infrastructure to support business applications in a secure, scalable, and flexible manner.
What It All Means
While these six areas provide a framework for Ironside’s roadmap engagements, the key to obtaining organizational consensus is being able to articulate clear, achievable benefits. Ironside can help with that, too. While our technical expertise runs deep, we also have broad experience in business analytics strategy, advisory consulting, solution architecture, and technical implementation. We have a rare ability to communicate in both business speak and tech speak, and our years of implementing solutions have made us confident that our theories perform in reality.
Do you know your current analytics maturity level? Are you ready to start building a data & analytics roadmap? See where you stand today with our online self-assessment tool. It will help you establish the baseline understanding you need to embark on a larger strategic analytics journey.

References
1 Laney, Doug. “Data and Analytics Strategy Predictions through 2021.” Gartner Blog Network, December 19, 2016. http://blogs.gartner.com/doug-laney/data-analytics-strategy-predictions-through-2021/
About Ironside
Ironside was founded in 1999 as an enterprise data and analytics solution provider and system integrator. Our clients hire us to acquire, enrich and measure their data so they can make smarter, better decisions about their business. No matter your industry or specific business challenges, Ironside has the experience, perspective and agility to help transform your analytic environment.