Enable Bimodal Analytics with Cognos Analytics: Part 1

Well in advance of the IBM acquisition of Cognos, the Cognos name was synonymous with powerful, trusted enterprise business intelligence and managed reporting. Between its ability to scale to meet the needs of the largest enterprises, its robust, governed metadata layer that made it possible to report against a vast array of different data sources, powerful reporting capabilities churning out highly complex managed BI reporting solutions, and ad-hoc reporting and analysis against those governed data sources, IBM Cognos was the answer for almost all enterprise reporting needs. Until it wasn’t.
From the early days of ReportNet, Cognos was considered, in most circles, the hands down industry standard for what is now often termed “Mode 1” analytics. According to Gartner, Mode 1 is optimized for areas that are predictable and well understood.¹ Mode 1 analytics can be thought of as encompassing enterprise level analytics, where reporting data is stored in data marts, data warehouses and often transactional processing systems. It is the governed, single version of the truth that serves as the backbone of information used by the organization. It is the foundation for predefined content including executive dashboards, periodic reporting (daily, weekly, monthly, etc.), as well as interactive, prompted reporting and ad-hoc inquiries.
Ironically, due to the constantly changing state of organizations, these strengths also revealed inherent weaknesses. New data sources are often added to organizations through acquisition, 3rd party vendors, or new projects that are being brought online. The highly governed nature of traditional BI, aka Mode 1 analytics, can significantly impact the process of integrating these new data sources. It can be very time consuming and expensive to integrate new data into an existing, governed enterprise data source. Organizations often have to prioritize which new data is most important to the organization as a whole. This means that these trusted data sources can often be incomplete.
The Introduction of Mode 2
With these challenges in mind, BI vendors rushed in to fill the gaps and “Mode 2” analytics was born. These flexible, responsive Mode 2 tools allowed organizations the ability to analyze data that lived outside of the enterprise domain. They offered business users the ability to quickly analyze data from any number of internal and external data sources, giving them the flexibility to ask a completely new set of questions. Users could sift through multiple data sources and combine them quickly to find that golden nugget of insight needed to make critical business decisions. An analysis combining new datasets with existing enterprise data could now yield answers in minutes, hours or a handful of days, instead of weeks or months.
Not only were these Mode 2 solutions flexible, but they were also visually appealing, offering users a rich, immersive experience. Once again, the very flexibility that made this new mode of analytics so appealing to end users also had its drawbacks. Businesses began to adopt these Mode 2 vendors, often one department, project, or even individual at a time, and often without any involvement or oversight from the IT department. It wasn’t uncommon to see 2 or even 3 different Mode 2 vendors in very large corporations, operating outside the realm of IT governance.
With this Wild West of analytics gaining momentum, businesses began to grow concerned. Are these data sources reliable? Can they be trusted? Are analysts creating calculations in accordance with corporate standards? Are different people coming up with different conclusions from similar data sets due to timing, filters, analyst bias or a myriad of other reasons? Are these datasets, which are often silos of information, taken out of context, because they are not being compared to or combined with existing Enterprise data sources?
What was needed was a balance, a sweet spot, the ability to draw from the best of both worlds, delivering actionable information from existing, trusted enterprise sources combined with external and/or department level data. Businesses needed the ability to compare governed, trusted enterprise metrics to 3rd party benchmarks and industry datasets.
Becoming Bimodal
IBM released Cognos Analytics with those concerns in mind. The goal of Cognos Analytics (Cognos 11) is to blur the expanding lines between Mode 1 and Mode 2 analytics, delivering a platform for true Bimodal Analytics. IBM did this by introducing a set of capabilities geared towards enabling Mode 2 analytics at an enterprise level (on an enterprise scale) and allowing users to combine curated enterprise data with any number of external, department level or even personal datasets in order to create insightful and actionable analytics.
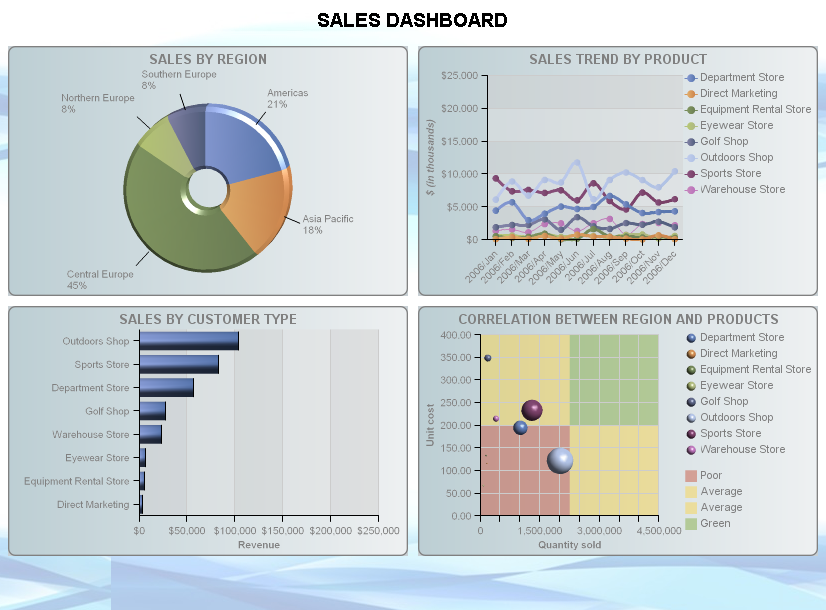
How did IBM approach this? For starters, unlike some of the Mode 2 vendors in the analytics space, IBM Cognos already delivers robust Mode 1 analytics via the trusted enterprise backbone that companies have relied on for years. To address the demand for Mode 2 analytics, IBM reimagined the Cognos Analytics authoring experience, delivering a well thought out, graduated set of capabilities targeted at different levels of users from casual business users through professional authors. They also introduced an intuitive Dashboarding capability, enabling end users and business analysts to quickly deliver rich, insightful content.
Finally, to enable end users and analysts to draw valuable insights that come from combining cultivated, trusted enterprise data with custom datasets, IBM introduced data modules. Data modules are one of the most underappreciated, misunderstood, and thus, underused features available in Cognos Analytics today. Why?
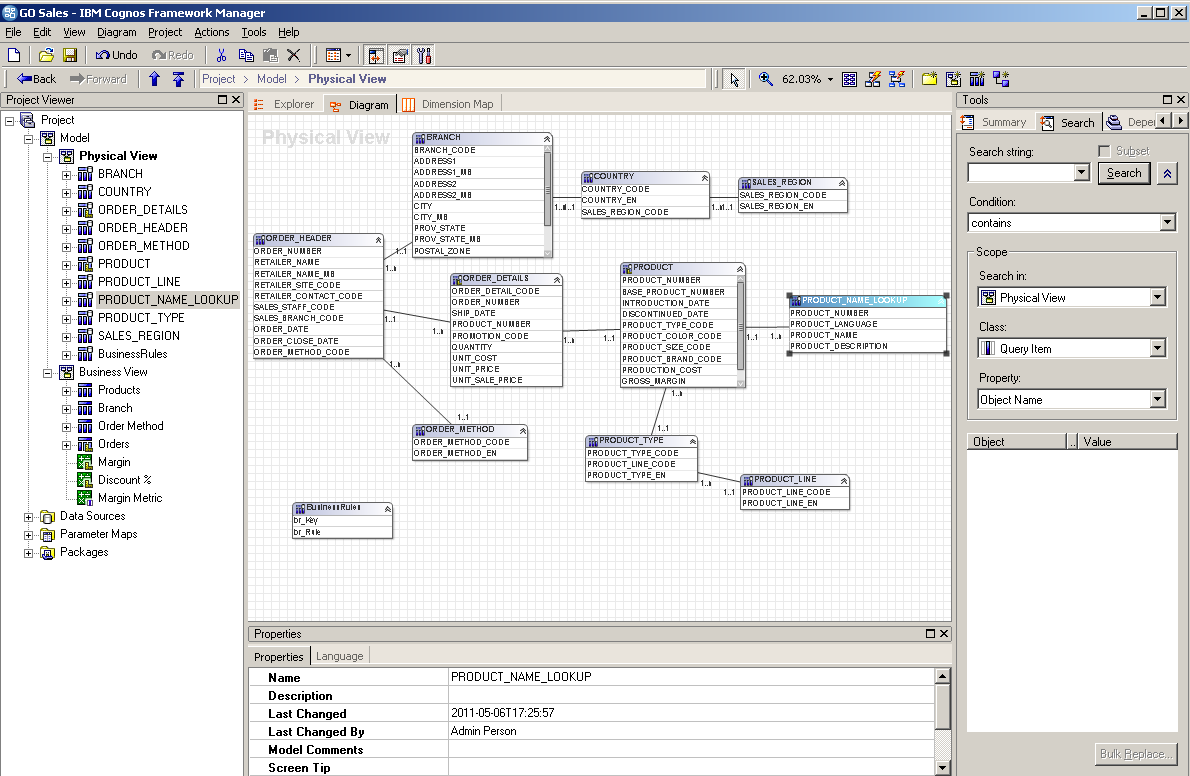
When IBM first released Cognos Analytics, data modules did not allow the user to connect directly to existing Framework Manager packages, and thus did not allow the user to directly merge enterprise data with their own datasets. While there were workarounds, this shortcoming was enough to effectively turn users away and into the arms of vendors who were born as Mode 2 analytics platforms.
Now, fast forward a couple of years and several releases later, data modules have matured to the point where it’s worth revisiting this underappreciated capability. In part 2 of our series, we’ll explore use cases and set the stage for a demo to dive deeper into a real world use case. Stay tuned.

References
1 “What Is Bimodal IT? See Gartner’s IT Glossary For The Answer.” Hype Cycle Research Methodology | Gartner Inc., Gartner, Inc., 21 Feb. 2017, www.gartner.com/it-glossary/bimodal/.
About Ironside
Ironside was founded in 1999 as an enterprise data and analytics solution provider and system integrator. Our clients hire us to acquire, enrich and measure their data so they can make smarter, better decisions about their business. No matter your industry or specific business challenges, Ironside has the experience, perspective and agility to help transform your analytic environment.

