Enable Bimodal Analytics with Cognos Analytics: Part 3

In the first installment of this series, we discussed the origins of Mode 2 Analytics, and in the second installment we focused on how to enable this capability in your organization using Cognos. Now that we’ve learned all about how Mode 2 works, let’s walk through a sample use case that highlights the Bimodal Analytics Lifecycle as well as the technical capabilities of Cognos Analytics and how they fit together.
In this example, you are the manager of a Healthcare Call Center system that is comprised of seven (7) regional centers across the country. Each call center handles contact (phone calls and online chats) from the customers that are located within the states that make up those regions.
Your company contracted with a third party vendor that provides Call Center survey tracking and satisfaction scoring. As part of a year-long paid prototype, they have surveyed Call Center contacts and provided you with the findings. The data consists of the key value for the State the customer is located in, the month, day of the week and the hour of the day in which the contact was made, an aggregate of the total number of completed surveys, and the total satisfaction score (a value from 1-10) for those days.
You have been tasked with seeing if the survey data is 1) valuable and brings any new insights to your Call Center operations, and 2) would be worth the investment of contracting with the survey company full-time and expanding the offering to include additional information at a more granular level. In other words, would Call Center survey data be worth the return on investment (ROI)?
Let’s Explore
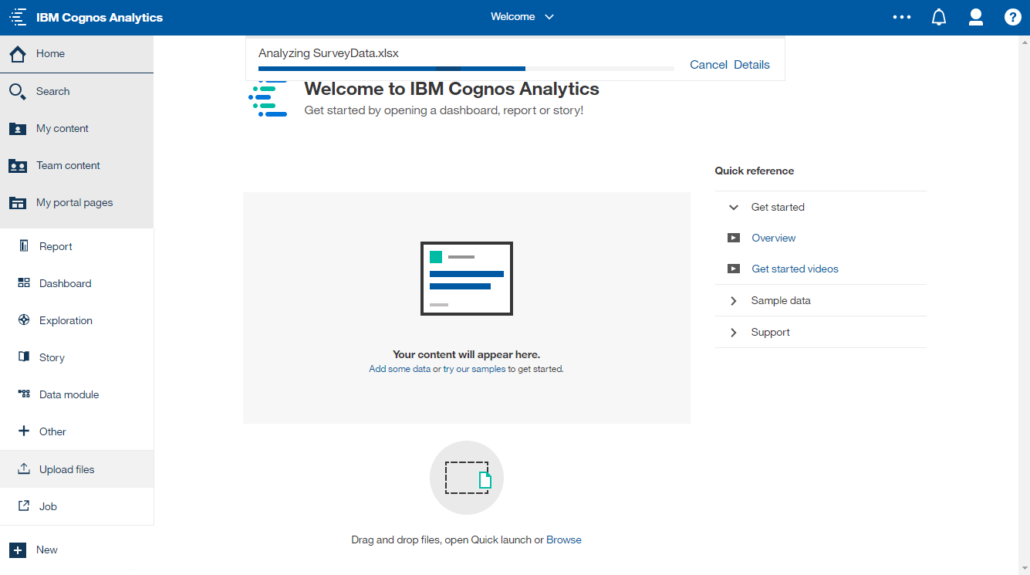
Your organization has just upgraded its Cognos environment to Cognos Analytics 11.1, so you decide to take a look at the Excel spreadsheet that the survey company has provided.
The first step is to upload the data. With Cognos Analytics, you can upload individual delimited flat files, multiple delimited flat files by multi-selecting them, multiple CSV files stored in a compressed (.zip) format, or multi-sheet Excel spreadsheets. Multiple files and sheets are stored as separate tables and once uploaded, can be replaced with new data or you can append new rows of data.
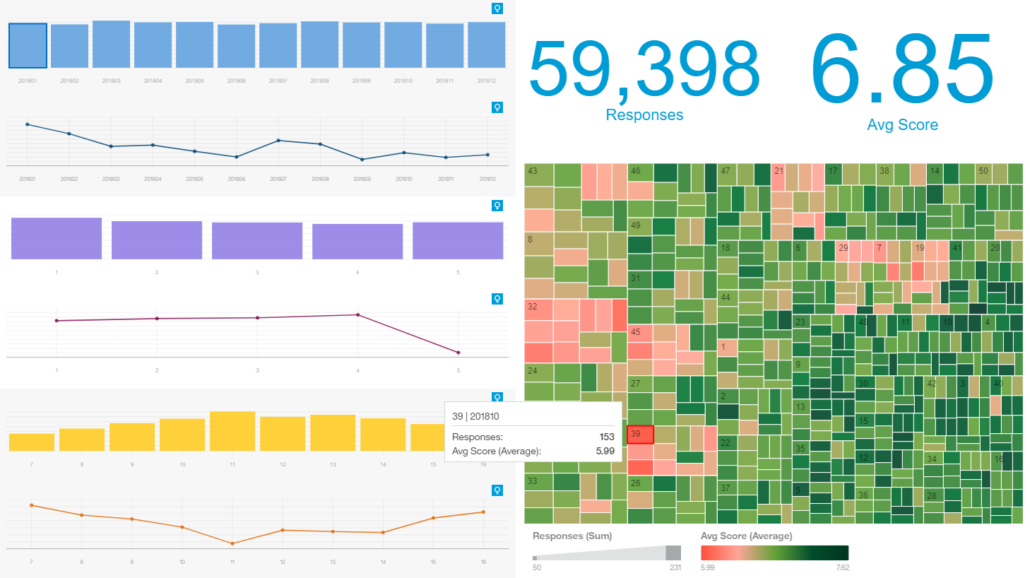
Now that the data has been uploaded and is available, we can build a quick dashboard to help highlight the data through visualizations. Cognos Analytics provides the ability to create calculations against an uploaded data source, expanding the usefulness of that data.
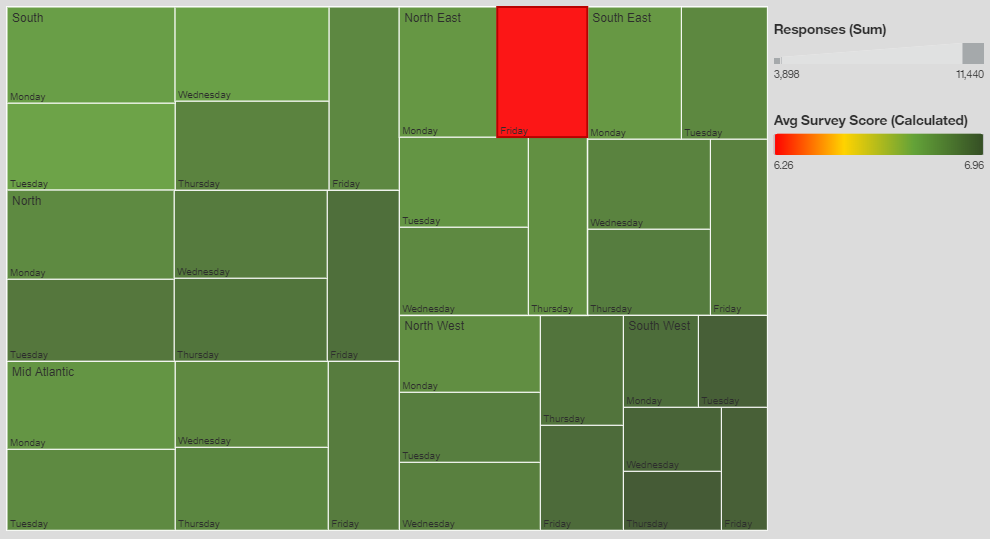
In this example, we display the number of survey responses and the average survey score overall, and then visualize those values by month, day of the week, and hour of the day. We also have a tree map by location (State key) and month, showing the number of responses (size) as well as the average survey score (color). It’s easy to see that there are a number of locations that have not scored well and there is a marked dropoff on surveys regarding Friday customer contact. Something worth looking in to…
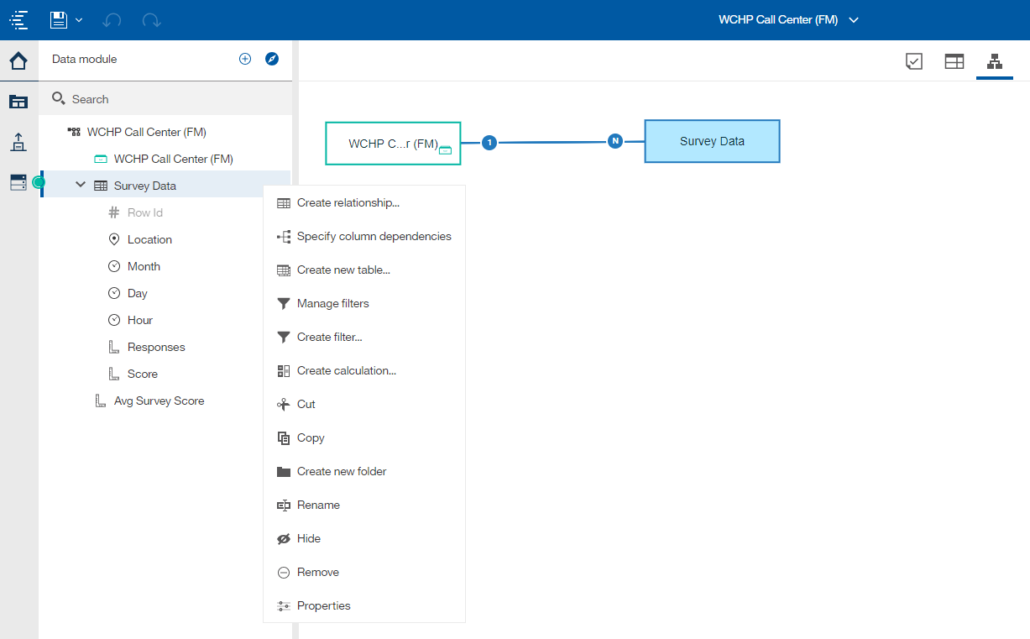
As a standalone entity, this data shows some promise, so the next step is to tie this data back to our existing Call Center data warehouse. This will allow us to see these survey scores across more of our defined dimensionality as well as see how it correlates with existing metrics. For that, we will use Cognos Analytics to build out a Data Module.
Data Modules are web-based metadata containers that allow users to pull information from uploaded files, existing Framework Manager packages, Data Server Connections directly to data sources, Data Sets (cached data), or other Data Modules. Users have the flexibility to create Relationships between data objects and specify Column Dependencies (similar to Determinants in a Framework Manager model). These eliminate the possibility of “double counting” when you have tables stored at differing levels of granularity. You can also create Calculations, Filters, Navigation paths (Hierarchies), and Folders for grouping items.
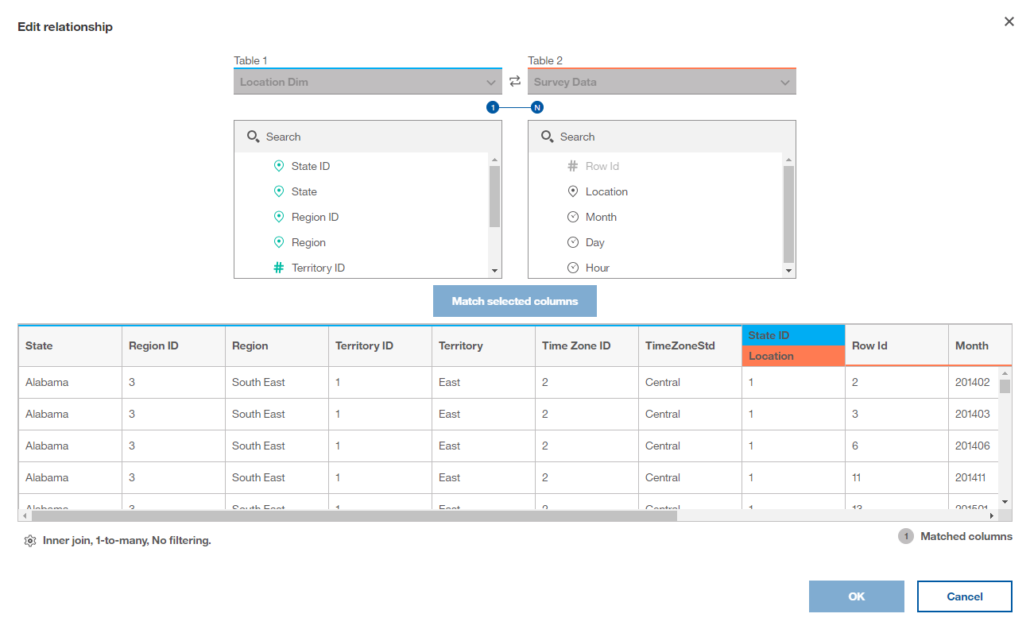
Below, the uploaded survey data is joined to the Location dimension that was modeled and made available in a Framework Manager package. In this case, you now have access to grouping levels such as Time Zone, Territory, and Region, as well as the fact data that the Location dimension is joined with.
Now that the uploaded survey data has been joined to our enterprise Call Center data warehouse, a more complete picture of the data can be drawn. Creating a quick tree map visualization that connects the survey data and our Location dimension shows a definitive issue with survey scores for Friday contacts in our Northeast Call Center, a much more pronounced difference than we originally may have seen.
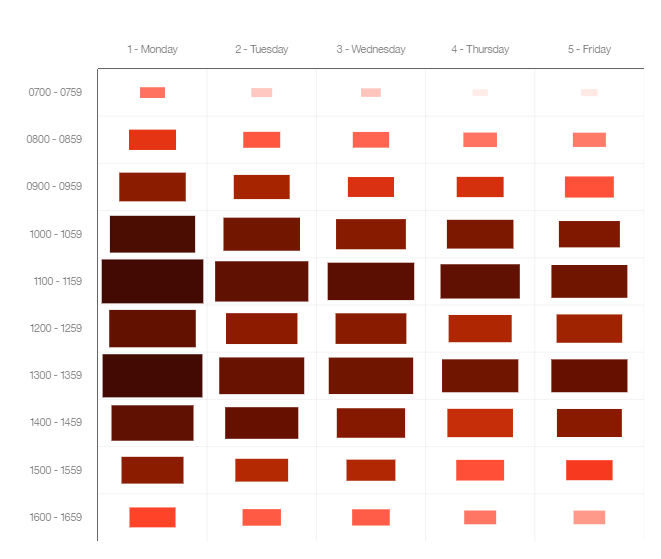
Next, we will look at two of the Call Center’s major metrics: Average Speed to Answer (ASA), which is denoted by the size of the block in the heat map visualizations below, and the Abandoned Rate (rate of calls/chats that are dropped prior to completion) – the higher the Abandoned Rate, the darker the color.
As you can see in the first chart that encompasses all of the available data, both metrics get better as the week goes on, with midday on Mondays being the highest ASA and Abandoned Rates, which correlates with expected contact volumes.
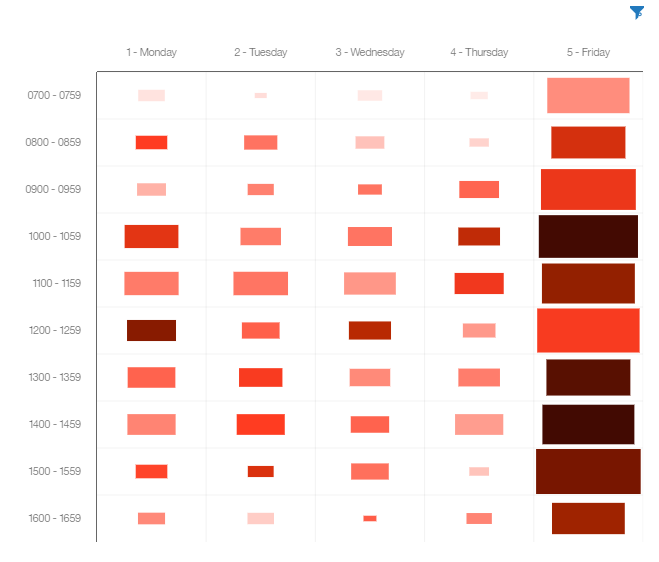
The next chart is filtered for 2018 and the Northeast regional call center. There seems to be a strong direct correlation with our Call Center metric performance and survey scores.
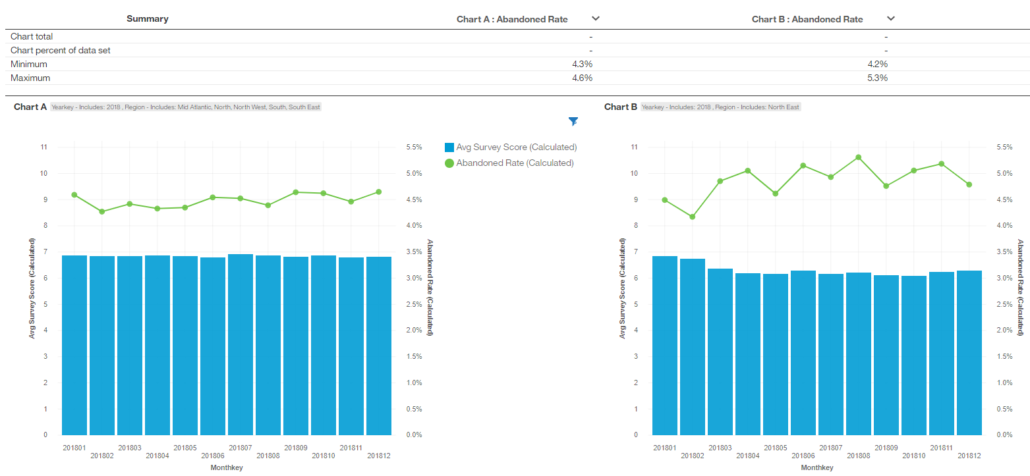
Finally, using the new Cognos Analytics Exploration capability, we can see a side-by-side comparison between the Northeast regional center and the rest of the call centers, showing the Abandoned Rate and the Survey Scores. Exploration provides an ad-hoc data discovery workspace, utilizing augmented intelligence once available in Watson Analytics. It uses sophisticated algorithms to deliver key drivers and predictors, accelerating the time to value by exposing insights in your data.
We have now shown that the survey data can provide insight into the affects that performance has on our customers’ satisfaction. Sharing this information through dashboards and reports will help others see that point, allowing the organization to take the necessary steps to bring that data into the Call Center data warehouse. Making this data part of a governed, enterprise data solution, and providing this information to others in the organization, closes the loop on the Bimodal Analytics Lifecycle. If the data had not proven valuable, the exercise would still be a success, allowing IT and Business users to focus on other data objects, looking for additional insight into the business.
Of course, this is an iterative process for forward thinking companies that are constantly looking for that next nugget of information to gain a competitive advantage. With Cognos Analytics and the Bimodal Analytics Lifecycle, the time to value of return on investment can be drastically reduced.
If you enjoyed this article and want to read more written by Bob O’Donnell, view his collection.

About Ironside
Ironside was founded in 1999 as an enterprise data and analytics solution provider and system integrator. Our clients hire us to acquire, enrich and measure their data so they can make smarter, better decisions about their business. No matter your industry or specific business challenges, Ironside has the experience, perspective and agility to help transform your analytic environment.

