Editor’s Note: This blog was originally posted on September 27, 2011, we recently reviewed and updated on October 5, 2020.
Over past major releases, Cognos has provided a couple predefined JavaScript library to interactive with report objects especially prompt objects. We find that traditional web standard JavaScript is still very useful due to the effort of migrating to IBM specific JavaScript library and flexibility to develop code at report level. Going forward we would encourage you to consider using the new custom controls provided by IBM Cognos Analtyics family product for new JavaScript application development. The new custom controls support the full interactive mode, provide much better end user experiences and support HTML5 standard. Some commonly seeded functionalities such as dynamic column sorting, filters are now built-in via full interactive viewer, and JavaScript is no longer needed. Read more here.
Note:
-
All information and examples are specifically designed for IBM Cognos Analytics Reporting tool based reports. It is assumed that the reader is familiar with Cognos Report Studio.
-
For more information about JavaScript and the HTML language basics please go to http://www.w3schools.com and other available web based tutorials.
-
Code development environment: IBM Cognos Analytics 11.1.x
5 – Reaching a Prompt Element
Obviously, in order to use JavaScript to modify or manipulate an element on a web page, you first need to reach or find the element you want to edit. As I mentioned in section 3 in the previous article, Cognos prompt pages and report pages are dynamically generated web pages. Prompts placed in Cognos reports are designed to take user inputs and submit requests to a web server. Like many other web pages a <Form> element is embedded on the page in order to accept user’s input. As you can imagine, all prompts elements are tied to this intake form. This allows us to easily access any prompt element once we find the form.
Here is the typical call you can use in JavaScript to find the “invisible” form in a Cognos report:
var fW = getFormWarpRequest();
Depending on the type of the prompt you are dealing with, you can get the prompt object using the following name convention:
|
Text Edit Box |
fw._textEditBox<prompt name> |
|
List Box |
fw._oLstChoices<prompt name> |
|
Drop Down List |
fw._oLstChoices<prompt name> |
|
Radio Button Group |
fw._oLstChoices<prompt name> |
|
Check Box Group |
fw._oLstChoices<prompt name> |
|
Date Edit Box |
fw.txtDate<prompt name> |
Let’s apply this logic to the sample report developed in the Part 1 of the previous article.
Steps:
- Open the previously saved sample report “mylist” in Reporting Tool. If you haven’t created it yet or lost it check IBM Cognos and JavaScript- Part I, Section 3 to create it.
- Go to Prompt Pages -> Prompt Page 1.
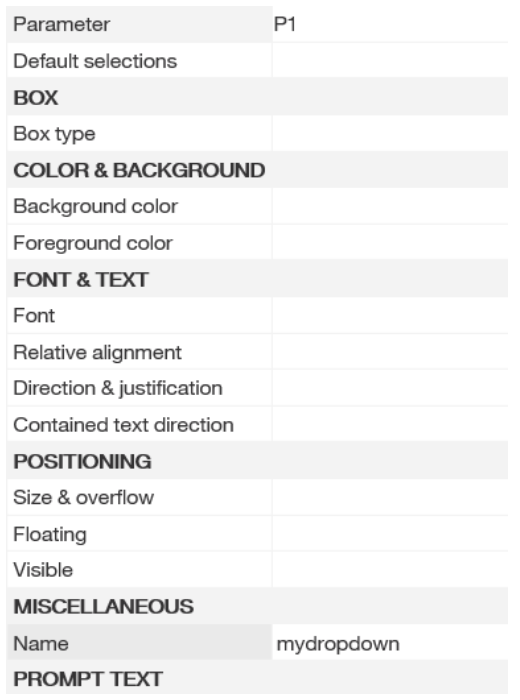
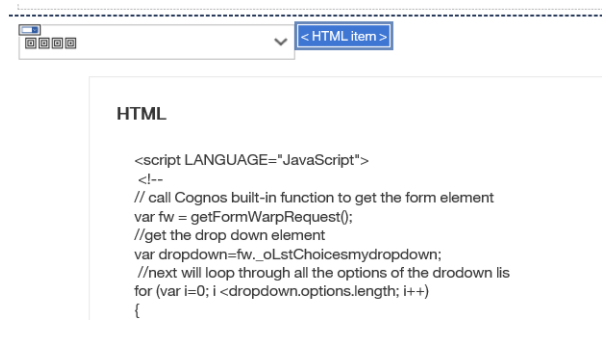
- Click on drop down prompt P1. On the properties panel under Miscellaneous->Name, give this prompt object a name such as “mydropdown”.
- Double click on the HTML item, added in the previous steps to create the report, next to report title. Change the JavaScript code to:
<script LANGUAGE=”JavaScript”>
<!–
// call Cognos built-in function to get the form element
var fw = getFormWarpRequest();
//get the drop down element
var dropdown=fw._oLstChoicesmydropdown;
//next will loop through all the options of the drodown lis
for (var i=0; i <dropdown.options.length; i++)
{
if (i >1) //skip the first two default options Cognos generated
alert (dropdown.options.text) ; //call alert function to display the text value of the option
}
//–>
</script>
- Move the HTML Item next to drop down prompt. Your report should look like below:
- Save the report.
- Run it from Reporting tool. You will see popup windows shown 5 times. Each one displays the text value of each option of the dropdown box.
6 – Reaching a Report Data Element
An IBM Cognos report page is really just a web page that dynamically displays report content based on data query results. The most frequently used data containers are lists and crosstabs. How do I access a list/crosstab then? Is that even possible? Fortunately the answer is yes. In section 3 of the last article, we examined the report page structure. A list or crosstab on report page is just a table element, styled and formatted according to Cognos global style sheets.
Steps:
- Open the previous saved sample report “mylist”
- Go to Report Pages -> Report Page 1
- Double click on the HTML Item, replace the JavaScript code with the following:
<script language=”JavaScript” type=”text/javascript”>
//<!–
var tbls = document.getElementsByTagName(“TABLE”) // first get all the table objects on the page
var tblCnt = tbls.length; // determine the number of tables
for(var t=0; t<tblCnt; t++) //loop through each table object
{
var tbl = tbls.item(t); // define the current table
if (tbl.className == “ls”) //this is our list table
{
var cell= tbl.rows(0).cells(0); // reach the first cell of the first row of the list table
alert( cell.firstChild.innerHTML); //display the first cell content/text
}
}
//–>
</script>
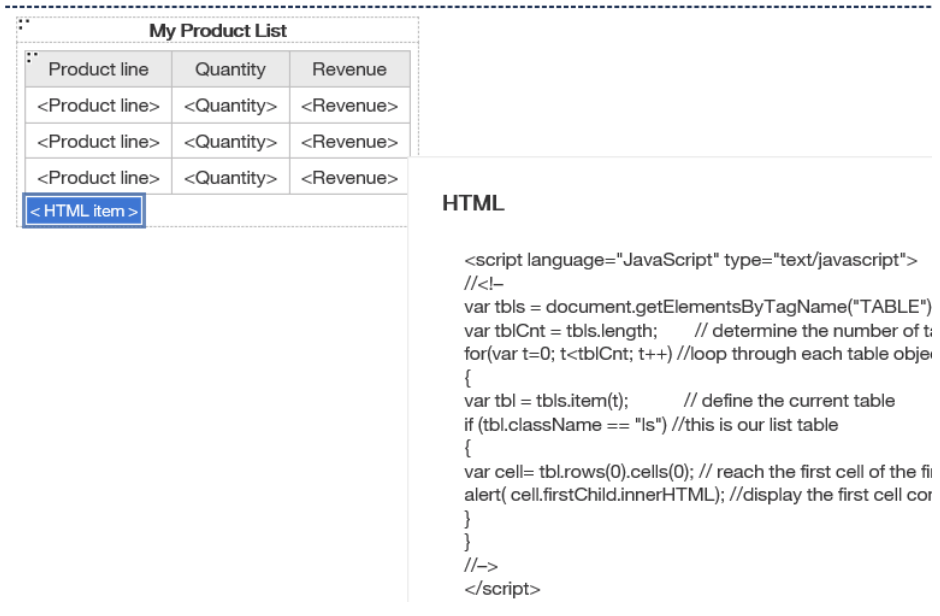
- Save the report.
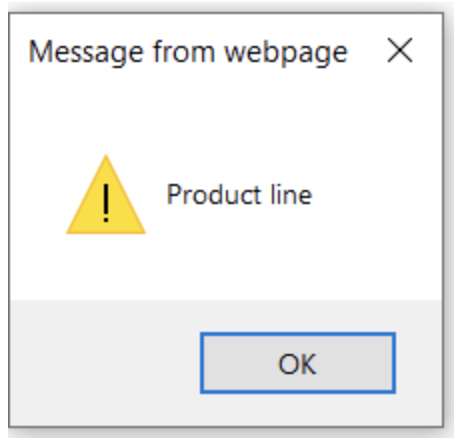
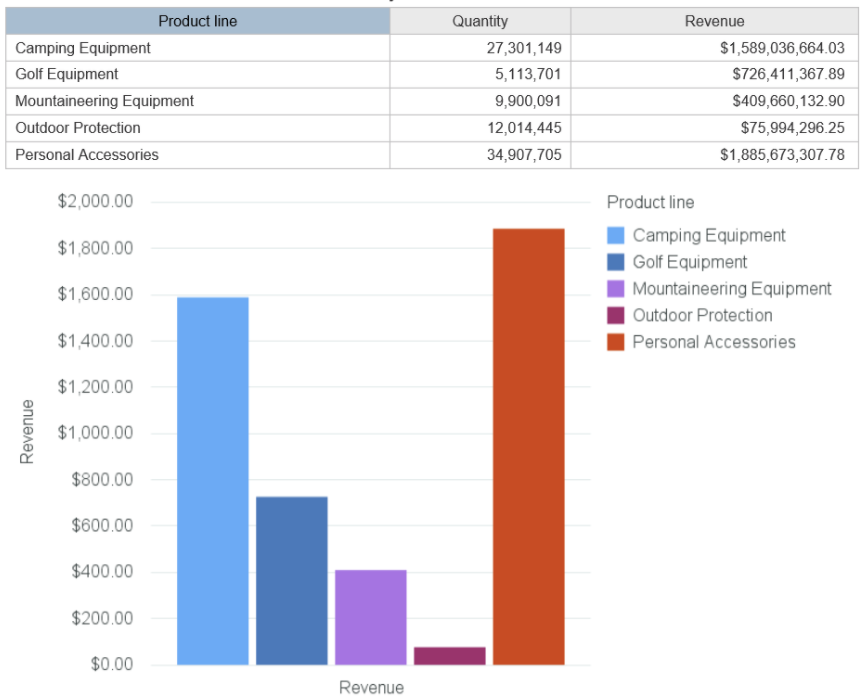
- Run it from Reporting tool. You will see a popup window that displays the first column header text “Product line”:
In the next couple steps, we are going to really start to enhance the abilities of the tool and modify an element’s attributes on a click event.
A HTML element may have many attributes:
- Attributes provide additional information about an element.
- Attributes are always specified in the start tag.
- Attributes come in name/value pairs like: name=”myname”, value=”code1″
- Attribute values should always be enclosed in quotes. Double style quotes are the most common, but single style quotes are also allowed.
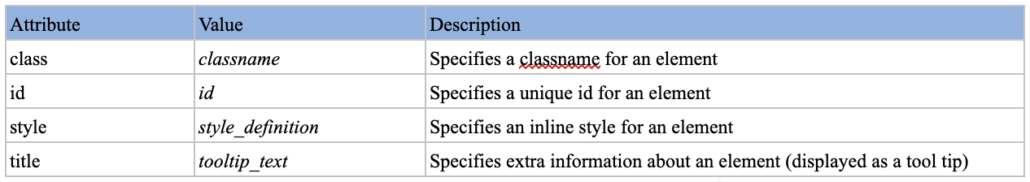
Below is a list of some attributes that are standard for most HTML elements:
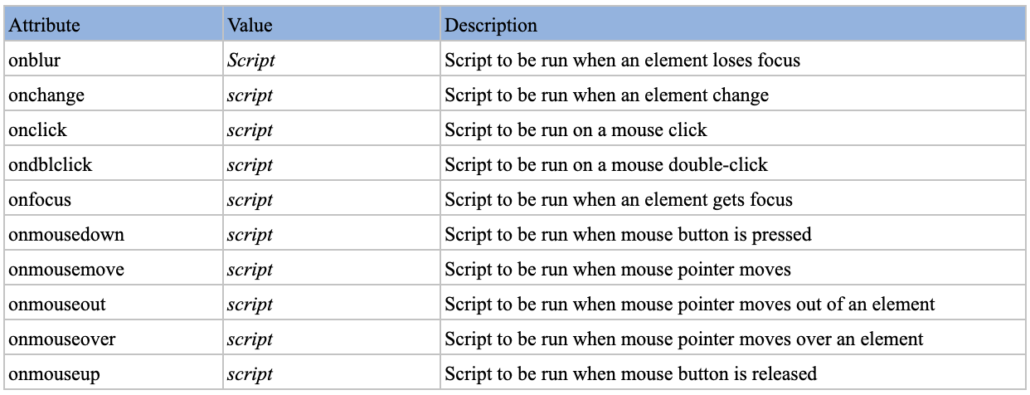
Event attributes vary for each element, here are some common ones:
7 – Edit a Prompt Element
In section 5, we learned how to reach a prompt element using JavaScript. Once you get an object you want to control, it simply becomes a task of modifying the attributes that you wish to alter.
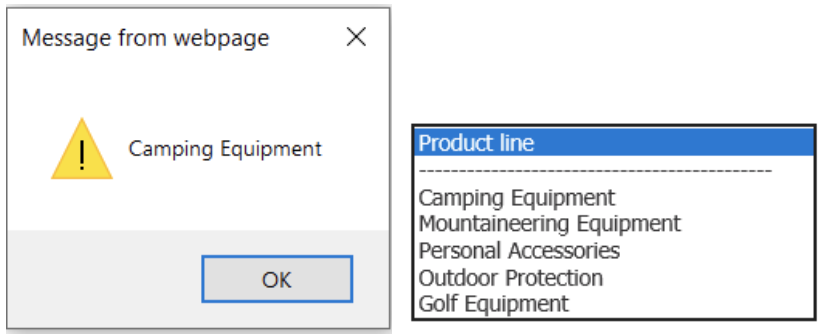
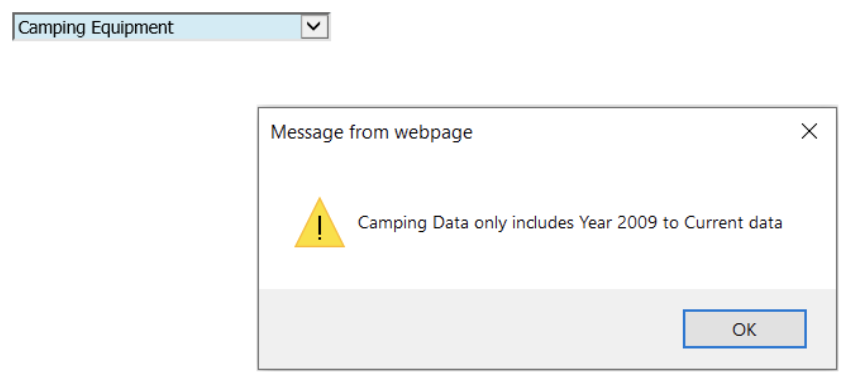
Let’s take a look at how JavaScript can remove the default style of the dropdown list prompt and add in a custom background color. When the user makes a selection from drop down list JavaScript will check which option the user selected. If Camping Equipment is selected a pop up alert will tell the user which years of data will be included in report.
Steps:
- Open the previous saved sample report “mylist”
- Go to Prompt Pages -> Prompt Page 1
- Double click on HTML Item and update the JavaScript to following:
<script LANGUAGE=”JavaScript”>
<!–
//call cognos built-in function to get the form
var fw = getFormWarpRequest();
// reach the dropdown list
var dropdown=fw._oLstChoicesmydropdown;
//clear the class attribute of the dropdown list
dropdown.className=”;
dropdown.style.backgroundColor=”#CEECF5″; //set back ground color
dropdown.onchange=check; //onchange event call check function
function check( )
{
var idx=dropdown.options.selectedIndex; //check which option is selected
if ( dropdown.options.value==”991″ ) //if camping equipment option is selected
alert (“Camping Data only includes Year 2009 to Current data”) ;
}
//–>
</script>
- Save the report.
- Run it from Reporting tool. You will notice that the background color of the drop down box is set to light blue, and a message will be popped up only when Camping Equipment selection is selected:
8 – Editing a IBM Cognos Report Data Element
Report data elements such as lists, crosstabs, and charts are different elements on a report page (a web page). Usually they are not tied to a web form as they are results based on user requests. That being said, it may require additional user interface items to be added to the report so that user requests can be processed. In the next demo we will use JavaScript to dynamically show or hide list object data based on a user selection. Custom buttons are added to facilitate the show/hide requests.
Steps:
- Open previous saved sample report “mylist”
- Go to Report Pages -> Report Page 1.
- Drag a chart object from the Insertable Objects pane.
- Set the chart to use the same data query that the list uses.
- Drag the Revenue data item as Default Measure of the chart.
- Drag Product line data item into the Series area.
- Save and run the report. You should have both the list and chart shown on the report.
- Drag a new HTML Item before the list table, and type in the following :
<input type=”button” value=”Show Data Table” onclick=”showhide()” id=”showbutton” style=”display: “>
<input type=”button” value=”Hide Data Table” onclick=”showhide()” id=”hidebutton” style=”display: none”>
- Double click on the other HTML Item added in the previous step and update the JavaScript to the following:
<script language=”JavaScript” type=”text/javascript”>
//<!–
var showbt=document.getElementById(“showbutton”); // get show button element
var hidebt=document.getElementById(“hidebutton”); //get hide button element
var tbls = document.getElementsByTagName(“TABLE”) // get all the tables on the page
var mylist;
var tblCnt = tbls.length; // determine the number of tables
for(var t=0; t<tblCnt; t++)
{ // check each table
var tbl = tbls.item(t); // define the current table
if (tbl.className == “ls”) // this is the list table
{
mylist=tbls;
mylist.style.display=”none”; //set it to be hidden
}
}
//dynamically show or hide list table, chart
function showhide()
{
if ( mylist.style.display==”none”) //if list is currently hidden
{
mylist.style.display=””; //set list to be shown
showbt.style.display=”none”; // hide “Show” button
hidebt.style.display=””; //show “Hide” button
}
Else //else if list is currently shown
{
mylist.style.display=”none”; //set list to be hidden
showbt.style.display=””; // make “Show” button displayed
hidebt.style.display=”none”; // make “Hide” button to be hidden
}
}
//–>
</script>
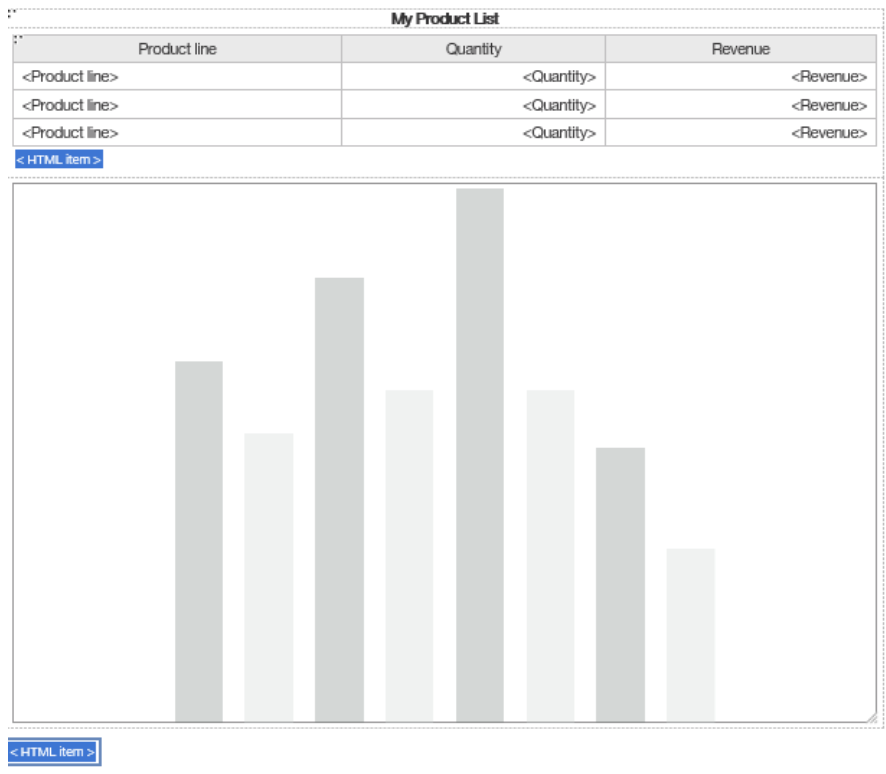
Your report should resemble the image below:
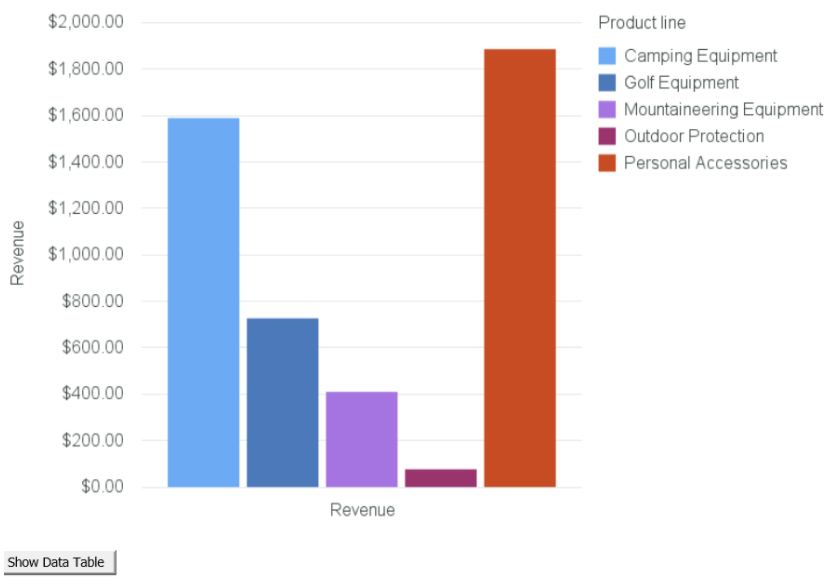
- Save and run the report again. By default the list data table is hidden.
- Click on the Show Data Table button, the list table will immediately be displayed. One of the benefits of using JavaScript here is that the report doesn’t have to re-run to dynamically perform the show or hide object action. Both list and chart are generated at report initial run. JavaScript simply shows or hides the list and chart at runtime.
Summary
Congratulations! Over the past few hours you have learned some fundamental JavaScript coding practices in Reporting tool. As you can see, it is not nearly as difficult as you may have feared. The business value of using JavaScript can plainly be seen in the above samples and is really limited to the user’s imagination. With a few lines of JavaScript code in Report, you can enhance the report’s user interface, usability, performance, dynamic interaction capabilities and many other options.
While JavaScript is an extremely useful tool, it is not recommended that IBM Cognos developers use JavaScript too heavily. We recommend that you think carefully before you actually start to develop and embed JavaScript in your reports. The primary concern is around the maintenance, upgrade and future sustainability. IBM Cognos web page structures and APIs have been known to change over the course of product releases, and you may have to upgrade JavaScript code after Cognos upgrades. For advice and best practices please feel free to contact us.