Tag Archive for: Amazon Quicksight

Today, Amazon QuickSight Announced Paginated Reporting; Cited Ironside as a QuickSight Delivery Partner

Connecting the Past to the Future

The past decade has seen a tremendous shift in how we consume analytics – from enterprise, templated, and paginated reporting to interactive, embedded dashboards with ML-augmented capabilities. It’s no surprise organizations have been eager to put these new tools in the hands of their employees. Unfortunately, they quickly realized a lift-and-shift approach for BI platforms requires extensive planning and training because of the fundamental differences between how legacy and modern BI tools address reporting needs.

Enterprise reporting has been the standard for decades. It’s what many business leaders and users alike are used to – and for good reason. Consumers could receive reports tailored to their individual needs and in various formats (PDF, CSV) on a scheduled cadence that contained all of their KPIs and performance metrics. Within the legacy BI space, organizations have been able to scale this extremely custom and robust reporting solution to their hundreds of users with great success for many years.

But in the age of big data, enterprises needed to approach data discovery and analysis differently. Data analysts became a highly valued and growing community within organizations. Companies rightly prioritized empowering these analysts to better leverage their technical skills and business acumen to drive meaningful impact. This meant migrating to modern BI platforms that favored interactive dashboards over reports numbering in the tens-of-hundreds of pages.

Among the many challenges of migrating from legacy to modern platforms was the reality that legacy users could no longer access reports with the same look and feel they’d grown accustomed to for years. Companies found that even with robust migration strategies, careful execution, and exhaustive change-management programs, they were left with reporting needs that neither a legacy system or modern BI tool could meet on its own. Instead, they had to maintain multiple systems to meet analysts’ needs for powerful dashboards and legacy users’ needs for robust operational reports.

Bridging the Gap

So – how do organizations move to a platform that incorporates the modern analytics movement of cloud-based, self-service and augmented analytics, while also creating limited friction for users entrenched in legacy reporting models? Amazon QuickSight Paginated Reporting is beginning to bridge the gap.

This release is centered around paginated reporting, distribution and analysis – the core tenets of an enterprise reporting implementation. The disparity between platforms continues to shrink, allowing organizations to spend more time evolving their new ideas rather than reimagining existing ones. Lastly, this release addresses an important piece to a successful adoption – creating a smooth transition for the user community.

Enterprise Reporting in the Cloud

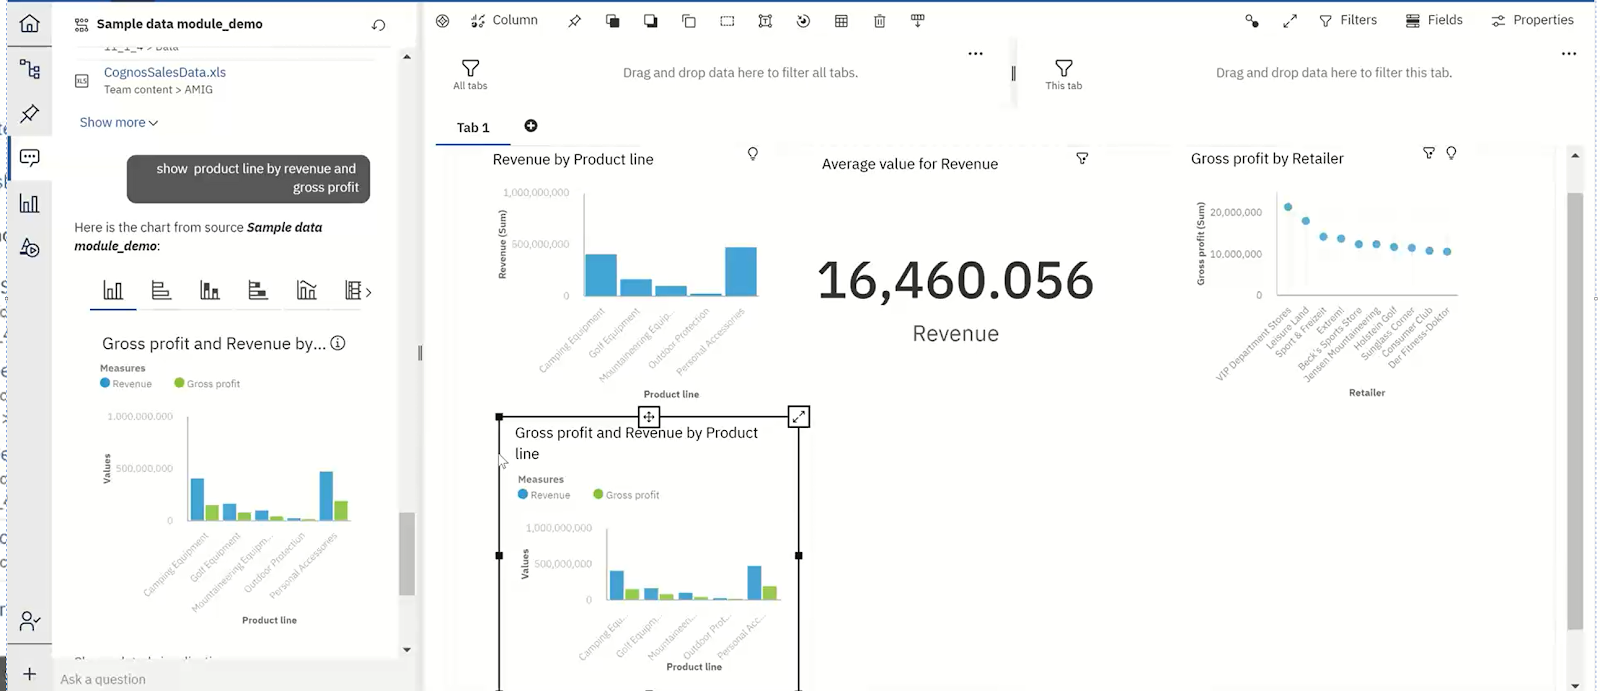
Enterprise reporting entails the delivery of insights in templated and tabular formats on a regular basis. Some users prefer fewer visualizations and more granular data, including pivot tables spanning multiple pages. Amazon QuickSight has new features that allow report authors to design, build and distribute presentation-ready formats from within the same platform.

  New report creation tools
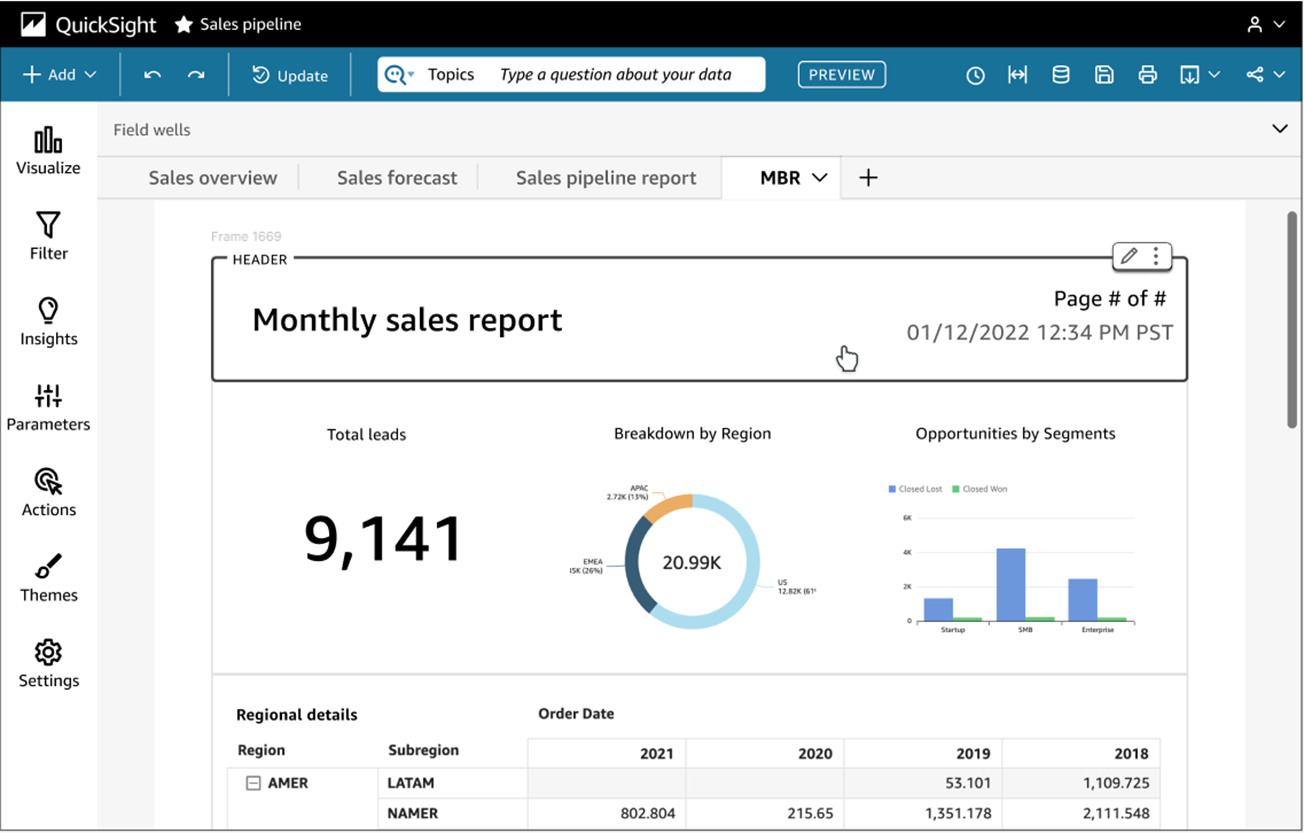
  • Headers & Footers
    Gives the author the ability to add custom report information within dedicated sections to make reports easier to scan and absorb
  • Page Margins, Padding Controls & Guardrails
    New formatting tools allow authors more flexibility in customizing how reports appear
  • Repeating Content
    Allows authors to quickly build stories by taking different slices of a particular chart and recreate them within a report

New report distribution and analysis tools

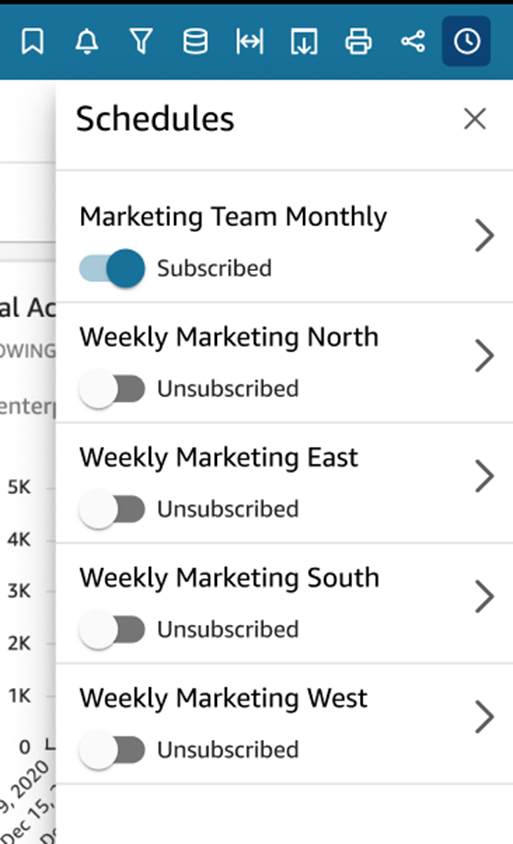
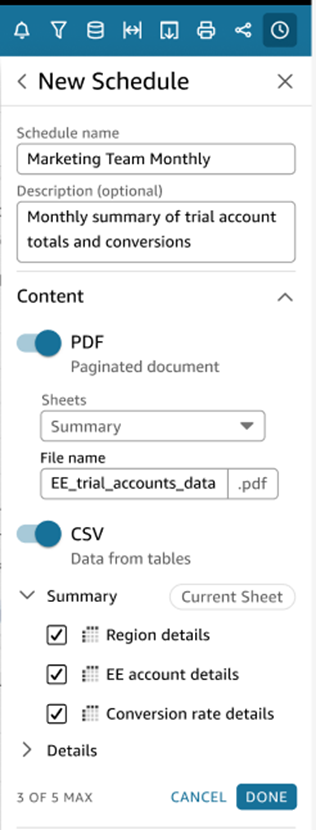
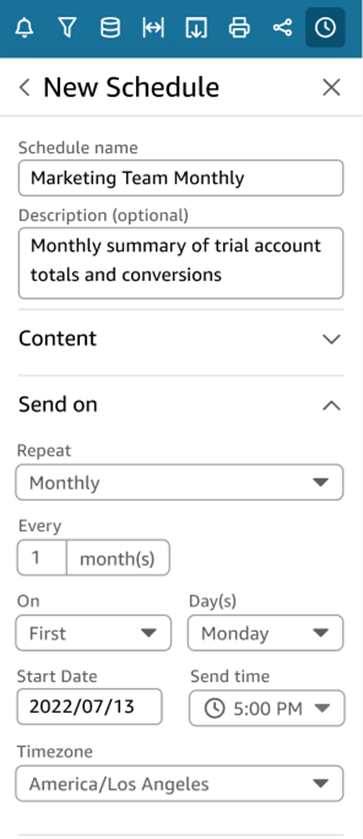
  • Custom schedules with enhanced features
    Gives administrators the flexibility to address the wide variety of distribution requirements from the user community
  • Historical snapshots
    Allows administrators to audit report delivery and track usage to inform scheduling
  • PDF or CSV
    Provides two options so users can receive reports in the desired format for effective analysis

Amazon QuickSight customers can rely on ongoing innovations. Some AWS releases feature exciting new technology. Other releases are about incorporating existing legacy functionality to better meet user needs. The goal is to help companies envision a future within a modern BI platform – and make getting there easier. Paginated Reporting accomplishes both.

Questions?

If you have questions about migrating to Amazon QuickSight, and how Ironside can help, email us at AscentIQ@IronsideGroup.com

Ironside is an Enterprise Data and Analytics firm and Advanced AWS Partner specializing in building innovative solutions leveraging AWS native analytics services. In a recent project, we worked with Homer Learning to build and launch a solution leveraging Amazon QuickSight to assist their marketing department gain greater visibility into the attribution and conversion of digital marketing spend. 

As a provider of digital education products to children via mobile and web, recent changes by the major industry ecosystem vendor data privacy terms & conditions (Apple & Google) have made tracking usage of Homer’s products very challenging. For the growth of their business, they needed to understand which digital advertising and marketing efforts were converting new customers and driving user consumption. 

Partnering with Homer’s data and analytics team, Ironside engaged to implement Amazon QuickSight Dashboards and Reports sourced from their data lake of advertising spend and user product usage information. The solution required close coordination with various business users within their marketing department and Homer analytics technical leadership to determine the effectiveness of advertising spend for both new user acquisition and user attention. 

Graphical user interface, chart

Description automatically generated

Exhibit A:Homer Learning Marketing Attribution Amazon QuickSight Dashboard and Reporting

Ironside’s Practice Lead for Business Intelligence, Scott Misage, shared, “The Homer Learning solution is interesting as it brings the headlines in the newspaper to customers engagement with the requirements, with Homer leveraging AWS to house their data analytics platform, Amazon QuickSight ”

Understanding the data elements from their variety of advertising and product platforms is essential for Homer’s marketing decision makers and is what Amazon QuickSight delivers. Ironside worked closely with business users to understand how they were looking to consume the data and align that to traditional and advanced features within Amazon QuickSight. Jin Chung, Sr. Architect, Analytics Platform at Homer shared, “The Ironside team worked closely with our business stakeholders to understand how they have interacted with the data previously and put forward solutions that could enhance that experience with some of the new features in Amazon QuickSight.” 

The Homer Amazon QuickSight environment is integrated to many other AWS analytics and management platform services that provide data processing and security capabilities. A key component of the platform is the aggregation of 3rd party data delivered to Homer via AWS S3 and blended in Databricks Delta Lake.  Ironside worked to create a secure and functional solution that integrated QuickSight to the Delta Lake with AWS Athena. 

About Ironside

Ironside helps companies translate business goals and challenges into technology solutions that enable insightful analysis, data-driven decision making and continued success. We help you structure, integrate and augment your data, while transforming your analytic environment and improving governance.

About Homer

The journey of parenthood begins without a map. As parents, we want the best for our kids. We want them to grow up to be confident lifelong learners who are ready to take on the world. At HOMER, our purpose is to give kids the best start to their learning journey during the window of opportunity—before the age of 6—where 85% of brain development takes place. We guide and champion children through this pivotal time as they build their skills and deepen their love of learning, and we partner with parents to provide the support that all kids need.


What is Natural Language Query?

Natural Language Query is the ability to use natural language expressions to discover and understand data and accelerates the process of finding answers that data can provide. Another way to think about it would be a translation mechanism that helps bridge the gap between technical and non-technical users who may not understand which database has the data, which field to use or how to create calculations to answer their questions.

An example might be “How many customers made a purchase this month?” And the idea is that the tool would respond and give you answers and visualizations that answer that question or at least help you on the path to finding it.

From an industry perspective, in 2017, Gartner predicted that by 2020 half of all analytics queries will be generated using natural language processing. As of 2021, we have seen all of the leading vendors in the analytics space adding functionality like this and many have had this functionality for 2+ years.

Tableau – Ask Data

Tableau released Ask Data in version 2019.1 (February 2019) and has continued to enhance and improve its functionality. To use Ask Data, simply navigate to the desired data source in Tableau Online or Tableau Server, type in a question and Tableau will answer that question in the form of an automatically generated visualization. From there, you can customize the visualization, add additional filters and save your analysis as its own report. Ask Data will also recommend questions based on your data source and offer suggestions to refine your question as you’re typing. 

Another feature of Ask Data is the ability to create synonyms for fields so similar terms can be mapped to an existing field. If your business users are used to referring to customers as clients, you can add the word client as a synonym for the customer field in order for Ask Data to interpret the word client. For data source owners and Tableau administrators, Ask Data provides a dashboard that displays the most popular queries and fields, number of visualization results that users clicked, etc. to understand habits and behaviors of those using Ask Data with a given data source.

Power BI – Q&A

Power BI’s natural language query tool, Q&A, was released in October 2019 and is available in both Power BI Service and Desktop. In Power BI Service, Q&A is available in the upper-left corner of your dashboard. Similar to Ask Data, you can type in a question and Power BI will pick the best visualization to display your answer and if you’re the owner of the given dashboard, you can pin the visualization to your dashboard. It’s important to note that Q&A will only query datasets that have a tile on the dashboard you’re using so if you remove all the tiles from one dataset, Q&A will no longer have access to that dataset. To use Q&A while editing a report in Desktop or Power BI Service, select “Ask a Question” from the toolbar and type your question in the text box that appears.

Teach Q&A is a feature that allows you to train Q&A to understand words it doesn’t recognize. For example, someone asks “What are the sales by location?” but there is no field called “location” in the dataset. Using Teach Q&A, you can indicate that location refers to the region field and moving forward, Q&A will recognize that location means region.

Cognos Analytics – AI Assistant

AI Assistant was released in version 11.1 in September 2018 and can be used to explore data in Dashboards and Stories. AI Assistant is available by clicking the text bubble icon in the Navigation panel. Unlike the tools mentioned above, the AI Assistant interface appears more like a chat window where your conversation history is saved. You ask a question about the data, receive an answer, then can continue asking additional questions and scroll back in the history to view the whole “conversation”.  After asking a question, the AI Assistant will respond with an auto-generated visualization, that you can customize if desired, and then drag onto your dashboard canvas. 

Amazon QuickSight – Q

Amazon QuickSight, the newest of the tools discussed, released a preview of their natural language query tool, Q, in December 2020. Like the tools mentioned above, Q is a free-form text box found at the top of your dashboard where you can specify the data source you want to explore and ask your question. If Q does not sufficiently answer your question, you can provide feedback to correct the answer and that feedback is sent to the BI team to improve or enhance the data.

Overall

Tableau – Ask DataPower BI – Q&ACognos Analytics – AI AssistantAmazon QuickSight – Q
Release DateFeb 2019Oct 2019Sep 2018Dec 2020
Suggests Questions
Create Synonyms
Auto-Generates Visualizations
NLQ User Log

Overall, these tools are all similar in how they are used/function and all have the same goal – to make it easier and faster for business users to get answers from their data.

This blog post originated from our Take30 session around Natural Language Query, presented by Ursula Woodruff-Harris, Scott Misage, & John Fehlner.