Natural Language Query – How Today’s Top Vendors Use It
What is Natural Language Query?
Natural Language Query is the ability to use natural language expressions to discover and understand data and accelerates the process of finding answers that data can provide. Another way to think about it would be a translation mechanism that helps bridge the gap between technical and non-technical users who may not understand which database has the data, which field to use or how to create calculations to answer their questions.
An example might be “How many customers made a purchase this month?” And the idea is that the tool would respond and give you answers and visualizations that answer that question or at least help you on the path to finding it.
From an industry perspective, in 2017, Gartner predicted that by 2020 half of all analytics queries will be generated using natural language processing. As of 2021, we have seen all of the leading vendors in the analytics space adding functionality like this and many have had this functionality for 2+ years.
Tableau – Ask Data
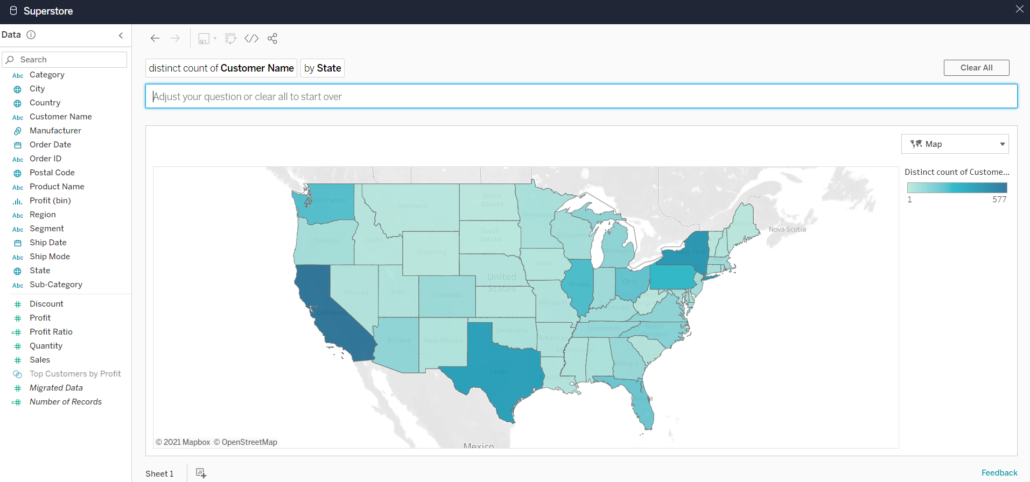
Tableau released Ask Data in version 2019.1 (February 2019) and has continued to enhance and improve its functionality. To use Ask Data, simply navigate to the desired data source in Tableau Online or Tableau Server, type in a question and Tableau will answer that question in the form of an automatically generated visualization. From there, you can customize the visualization, add additional filters and save your analysis as its own report. Ask Data will also recommend questions based on your data source and offer suggestions to refine your question as you’re typing.

Another feature of Ask Data is the ability to create synonyms for fields so similar terms can be mapped to an existing field. If your business users are used to referring to customers as clients, you can add the word client as a synonym for the customer field in order for Ask Data to interpret the word client. For data source owners and Tableau administrators, Ask Data provides a dashboard that displays the most popular queries and fields, number of visualization results that users clicked, etc. to understand habits and behaviors of those using Ask Data with a given data source.
Power BI – Q&A

Power BI’s natural language query tool, Q&A, was released in October 2019 and is available in both Power BI Service and Desktop. In Power BI Service, Q&A is available in the upper-left corner of your dashboard. Similar to Ask Data, you can type in a question and Power BI will pick the best visualization to display your answer and if you’re the owner of the given dashboard, you can pin the visualization to your dashboard. It’s important to note that Q&A will only query datasets that have a tile on the dashboard you’re using so if you remove all the tiles from one dataset, Q&A will no longer have access to that dataset. To use Q&A while editing a report in Desktop or Power BI Service, select “Ask a Question” from the toolbar and type your question in the text box that appears.

Teach Q&A is a feature that allows you to train Q&A to understand words it doesn’t recognize. For example, someone asks “What are the sales by location?” but there is no field called “location” in the dataset. Using Teach Q&A, you can indicate that location refers to the region field and moving forward, Q&A will recognize that location means region.
Cognos Analytics – AI Assistant
AI Assistant was released in version 11.1 in September 2018 and can be used to explore data in Dashboards and Stories. AI Assistant is available by clicking the text bubble icon in the Navigation panel. Unlike the tools mentioned above, the AI Assistant interface appears more like a chat window where your conversation history is saved. You ask a question about the data, receive an answer, then can continue asking additional questions and scroll back in the history to view the whole “conversation”. After asking a question, the AI Assistant will respond with an auto-generated visualization, that you can customize if desired, and then drag onto your dashboard canvas.
Amazon QuickSight – Q

Amazon QuickSight, the newest of the tools discussed, released a preview of their natural language query tool, Q, in December 2020. Like the tools mentioned above, Q is a free-form text box found at the top of your dashboard where you can specify the data source you want to explore and ask your question. If Q does not sufficiently answer your question, you can provide feedback to correct the answer and that feedback is sent to the BI team to improve or enhance the data.
Overall
| Tableau – Ask Data | Power BI – Q&A | Cognos Analytics – AI Assistant | Amazon QuickSight – Q | |
| Release Date | Feb 2019 | Oct 2019 | Sep 2018 | Dec 2020 |
| Suggests Questions | ✓ | ✓ | ✓ | |
| Create Synonyms | ✓ | ✓ | ✓ | |
| Auto-Generates Visualizations | ✓ | ✓ | ✓ | ✓ |
| NLQ User Log | ✓ | ✓ |
Overall, these tools are all similar in how they are used/function and all have the same goal – to make it easier and faster for business users to get answers from their data.
This blog post originated from our Take30 session around Natural Language Query, presented by Ursula Woodruff-Harris, Scott Misage, & John Fehlner.


