Tag Archive for: Tableau

What is Natural Language Query?

Natural Language Query is the ability to use natural language expressions to discover and understand data and accelerates the process of finding answers that data can provide. Another way to think about it would be a translation mechanism that helps bridge the gap between technical and non-technical users who may not understand which database has the data, which field to use or how to create calculations to answer their questions.

An example might be “How many customers made a purchase this month?” And the idea is that the tool would respond and give you answers and visualizations that answer that question or at least help you on the path to finding it.

From an industry perspective, in 2017, Gartner predicted that by 2020 half of all analytics queries will be generated using natural language processing. As of 2021, we have seen all of the leading vendors in the analytics space adding functionality like this and many have had this functionality for 2+ years.

Tableau – Ask Data

Tableau released Ask Data in version 2019.1 (February 2019) and has continued to enhance and improve its functionality. To use Ask Data, simply navigate to the desired data source in Tableau Online or Tableau Server, type in a question and Tableau will answer that question in the form of an automatically generated visualization. From there, you can customize the visualization, add additional filters and save your analysis as its own report. Ask Data will also recommend questions based on your data source and offer suggestions to refine your question as you’re typing. 
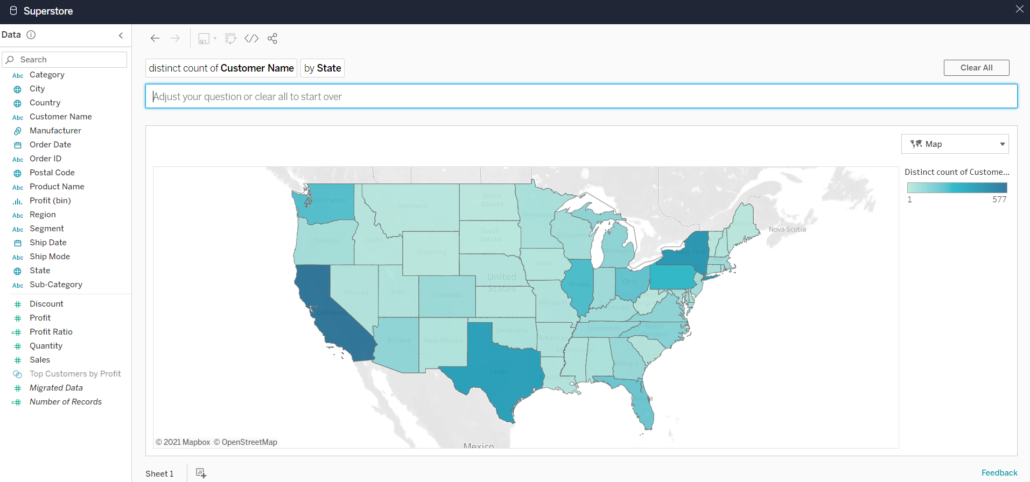
Another feature of Ask Data is the ability to create synonyms for fields so similar terms can be mapped to an existing field. If your business users are used to referring to customers as clients, you can add the word client as a synonym for the customer field in order for Ask Data to interpret the word client. For data source owners and Tableau administrators, Ask Data provides a dashboard that displays the most popular queries and fields, number of visualization results that users clicked, etc. to understand habits and behaviors of those using Ask Data with a given data source.

Power BI – Q&A

Power BI’s natural language query tool, Q&A, was released in October 2019 and is available in both Power BI Service and Desktop. In Power BI Service, Q&A is available in the upper-left corner of your dashboard. Similar to Ask Data, you can type in a question and Power BI will pick the best visualization to display your answer and if you’re the owner of the given dashboard, you can pin the visualization to your dashboard. It’s important to note that Q&A will only query datasets that have a tile on the dashboard you’re using so if you remove all the tiles from one dataset, Q&A will no longer have access to that dataset. To use Q&A while editing a report in Desktop or Power BI Service, select “Ask a Question” from the toolbar and type your question in the text box that appears.

Teach Q&A is a feature that allows you to train Q&A to understand words it doesn’t recognize. For example, someone asks “What are the sales by location?” but there is no field called “location” in the dataset. Using Teach Q&A, you can indicate that location refers to the region field and moving forward, Q&A will recognize that location means region.

Cognos Analytics – AI Assistant

AI Assistant was released in version 11.1 in September 2018 and can be used to explore data in Dashboards and Stories. AI Assistant is available by clicking the text bubble icon in the Navigation panel. Unlike the tools mentioned above, the AI Assistant interface appears more like a chat window where your conversation history is saved. You ask a question about the data, receive an answer, then can continue asking additional questions and scroll back in the history to view the whole “conversation”.  After asking a question, the AI Assistant will respond with an auto-generated visualization, that you can customize if desired, and then drag onto your dashboard canvas. 

Amazon QuickSight – Q

Amazon QuickSight, the newest of the tools discussed, released a preview of their natural language query tool, Q, in December 2020. Like the tools mentioned above, Q is a free-form text box found at the top of your dashboard where you can specify the data source you want to explore and ask your question. If Q does not sufficiently answer your question, you can provide feedback to correct the answer and that feedback is sent to the BI team to improve or enhance the data.

Overall

Tableau – Ask DataPower BI – Q&ACognos Analytics – AI AssistantAmazon QuickSight – Q
Release DateFeb 2019Oct 2019Sep 2018Dec 2020
Suggests Questions
Create Synonyms
Auto-Generates Visualizations
NLQ User Log

Overall, these tools are all similar in how they are used/function and all have the same goal – to make it easier and faster for business users to get answers from their data.

This blog post originated from our Take30 session around Natural Language Query, presented by Ursula Woodruff-Harris, Scott Misage, & John Fehlner.

The world has changed dramatically over the course of a single month, and companies are struggling even more with things that have historically challenged them:

  • Finding the best people to run, build and innovate on their analytics tools and data
  • Making these environments accessible to employees in a work-at-home model

In this Forbes article, Louis Columbus cites a recent Dresner survey that shows up to 89% of companies are seeing a hit to their BI and Analytics budgets due to COVID-19. The survey includes these two recommendations:

Recommendation #1

Invest in business intelligence (BI) and analytics as a means of understanding and executing with the change landscape.

Recommendation #2

Consider moving BI and analytical applications to third-party cloud infrastructure to accommodate employees working from home.


89% of companies are seeing a hit to their BI and Analytics budgets due to COVID-19.


We’re here to help you explore your options.

Now that the role of analytics is more important than ever to a company’s success, analytics leaders are again being asked to do much more with much less — all while companies are experiencing staff reductions, navigating the complexities of moving to a work-from-home model, and struggling to onboard permanent hires.

To address these short-term shortages (and potentially longer-term budget impacts), companies are naturally evaluating whether leveraging a managed-service approach — wholly or even just in part— can help them fill their skills gap while also reducing their overall spend.

As they weigh this decision, cost, technical expertise, market uncertainty and the effectiveness of going to a remote-work model are all top-of-mind. Here’s how these factors might affect your plans going forward:

Factor 1: Cost

As the Dresner number showed, most analytics teams need to reduce spend. Doing this mid-year is never easy, and usually comes at the expense of delayed or canceled projects, delayed or cancelled hiring, and possibly even staff reductions. All of these decrease a company’s analytics capabilities, which in turn decreases its ability to make the right business decisions at a critical time. A managed services approach to meeting critical analytics needs, even just to address a short-term skills gap, can provide valuable resources in a highly flexible way, while saving companies significant money over hiring staff and traditional consulting models.

Factor 2: Technical Expertise

A decade ago, your options for analytics tools and platforms were limited to a handful of popular technologies. Today even small departments use many different tools. We have seen organizations utilizing AWS, Azure, and private datacenters. Oracle, SQL Server, Redshift all at the same company? Yes, we have seen that as well. Some of our customers maintain more than five BI tools. At some point you have to ask: Can we hire and support the expertise necessary to run all these tools effectively? Can we find and hire a jack-of-all trades?

In a managed services model, companies can leverage true experts across a wide range of technology while varying the extent to which they use those resources at any particular time. As a result, companies get the benefit of a pool of resources in a way that a traditional hiring approach simply cannot practically provide.

Factor 3: Effectiveness of Remote Work Engagement

If you weren’t working remotely before, you probably are now. Companies are working to rapidly improve their processes and technologies to adjust to a new normal while maintaining productivity.

Managed service resourcing models have been delivering value remotely for years, using tools and processes that ensure productivity. Current events have not affected these models, therefore making them an ideal solution for companies  trying to figure out the best way to work at home.

Times are changing. We’re ready!

Ironside has traditionally offered Managed Services, to care for and maintain customer platforms and applications, and consulting services, to assist in BI and Analytics development.

Companies can leverage our Analytics Assurance Services temporarily, for a longer period of time to address specific skills gaps, or to establish a cloud environment to support remote analytic processes.

With Ironside, you can improve your data analytics within your new constraints, while reducing your costs. We’d love to show you how.

Contact us today at: Here2Help@IronsideGroup.com

One size does not fit all. Try as they might, there is not a single BI platform that can offer every capability that users require. With organizational complexity increasing, and the growing demand for self-service analytics, it has become commonplace, even recommended, for organizations to maintain multiple BI platforms to meet the needs of people in diverse roles with differing needs across the organization. Read more

We’re getting ready for Tableau Conference 2016 here at Ironside. With only a short time left until November 7th, our team is preparing for which parts of the conference they’re most excited to take in. And, more importantly, developing strategies for prioritizing where to spend their time. I got a chance to catch up quick with Crystal Meyers and Katelyn Tolbert, two of our Tableau-certified consultants, to hear what they’re looking forward to and get their perspectives on where people should be focusing at the conference. Read more

Tableau 10 was released on August 15th, and it is quite an upgrade. I’ve been spending some time doing hands-on testing of the new version, and I’m excited to share some of the new features I’ve explored with you.

In addition to a new custom font, new color palettes, and new themes that make Tableau more beautiful and visually appealing than ever, Tableau 10 has made great strides in bringing some of the most widely requested features from past releases into reality for this one. I’m going to walk you through some of the ones we at Ironside find most compelling and explain what the practical impact of each one is on the overall functionality of Tableau. This article will cover the following new features: Read more

If modern business data is a river, then traditional enterprise business intelligence is a bucket. Sure, you can pull some valuable and reliable insights at regular intervals that will help you take the pulse of what’s going on day to day, but there’s a much larger percentage of valuable insight that’s just going to wash by. That’s why having a complementary data discovery strategy is so important: it helps you be where you need to be in that flood to catch what’s most relevant to your current business concerns. One of the ways Ironside is helping our clients get to this level of self-service flexibility is by becoming a Tableau partner. Read more

Tableau’s powerful data discovery and visual analytics capabilities make it an ideal tool for enabling end users to achieve data driven insights at the speed of business.  It puts data in the hands of the business users who have the most to gain from it in an intuitive manner that allows for rapid visualization and actionable insight through self-service analytics. Read more

The BI software market is continually becoming larger and more complex to navigate.  Any organization looking to implement, update, complement, or replace BI tools has surely been inundated with information from dozens of vendors offering potentially hundreds of business analytics technologies.  How does one begin the process of narrowing the playing field and choosing the right solution?

Ironside is here to help. This article represents our thoughts on what to look for in a BI tool and explores some of the tools we think work well in different business cases: Birst, IBM Cognos Analytics, Microsoft, MicroStrategy, Qlik, and Tableau. Read more

Tag Archive for: Tableau