The BI Tool Roundup: Finding What Fits

The BI software market is continually becoming larger and more complex to navigate. Any organization looking to implement, update, complement, or replace BI tools has surely been inundated with information from dozens of vendors offering potentially hundreds of business analytics technologies. How does one begin the process of narrowing the playing field and choosing the right solution?
Ironside is here to help. This article represents our thoughts on what to look for in a BI tool and explores some of the tools we think work well in different business cases: Birst, IBM Cognos Analytics, Microsoft, MicroStrategy, Qlik, and Tableau.
Let’s begin by defining what makes something a BI tool, and then we will discuss what makes it a good BI tool.
BI Tools Defined: Laying the Foundation
At its most basic, a BI tool is any platform that offers the ability to query databases. SQL and MDX are the query languages most commonly used, but many platforms offer other options as well.
Obviously, the need to code queries by hand severely limits the audience that will be able to use a solution, so BI tools will typically have a graphical user interface (GUI) that allows for manipulation of the data via drag-and-drop capabilities while the system codes the query itself in the background.
Finally, a BI tool should not be a solution that needs to be embedded within another application, like an ERP system, in order to be functional. It should be a standalone, self-contained platform. That doesn’t pare down the list by much, if at all, but it does provide a baseline definition for what BI tools are and what they do.
Good BI Tools: What Matters?
The BI tool that will be best for you largely depends on what you as an organization, and your end users, hope to accomplish with it. If you are reading this article hoping to get insight into what the number one BI tool on the market is, you will not get that answer. The best BI tool FOR YOU will be the one that has the most suitable capabilities to meet the USE CASES that your organization has identified. This is not the same for all, or even very many, organizations.
Every tool listed in the latter part of this article has things that it does very well and things that other tools do better than it. In some cases, you will see that vendors provide multiple technologies to enable a full suite of BI capabilities. This is because there truly is no one-size-fits-all, one-stop-shop solution when it comes to BI, so the first step in selecting the right platform has to be an introspective one. Your organization must first determine where your pain points are and what business problems you’re looking for your BI tools to help solve.
If you’re still reading, let’s assume you have some of those use cases in mind. The bulk of the rest of this article will focus on what we define as ‘modern’ BI platforms.
Modern BI Platforms
Modern BI platforms are those that allow the proper balance between traditional BI capabilities and agile, user-focused capabilities. Another term for this is bimodal BI.
Mode 1
Mode 1 of bimodal BI refers to the traditional capabilities of large enterprise BI platforms:
- Production and operational reporting, often incorporating data from multiple areas of an enterprise, which can be scheduled and distributed via email or other mechanisms
- Ad hoc querying by business users
- OLAP or slice and dice analytics
- IT-built and deployed dashboards and visualizations
Typically, you’ll see these four capabilities within a platform that offers multiple tools leveraging a common architecture and metadata in order to promote governance and central provisioning. These traditional capabilities are the core of BI, and have been the focus of major vendors and platforms for decades.
With that said, however, the past few years have seen a shift to a more self-service focus, and easy-to-use tools that require less involvement up front from IT are gaining wide adoption due to their ability to offer a more agile, autonomous solution to the end user.
Mode 2
Mode 2 of bimodal BI focuses on these capabilities, which typically provide more rapid time to insight:
- Search-based analytics
- User-built data visualizations and dashboards
- Data discovery
- Ease of deployment and use
The most astute BI vendors have seen this shift coming, and have accommodated the growing need for balance between agility and governance by introducing new tools to an existing platform or additional functionality to existing tools. The tools and platforms that will be introduced and discussed below have the right combination of mode 1 and mode 2 capabilities to provide a robust end-to-end BI solution for most organizations.
Birst
Birst is an end-to-end BI platform originally built as a cloud-based solution. It is now available for deployment in a public or private cloud environment (Birst Enterprise Cloud) or on-premise (Birst Enterprise Virtual Appliance). Founded in 2004, it is one of the relative newcomers to the BI market (when compared to products from vendors like IBM, Microsoft, SAP, and SAS), but has proven itself to be every bit as powerful a solution for organizations desiring a cost-efficient, easy-to-deploy, user-focused solution. Birst offers strong data management and governance capabilities combined with decentralized analytics and governed data discovery. The tool’s ability to automatically generate dimensional models off of a data source is a unique and very helpful feature that reduces the overhead associated with extensive data modeling.
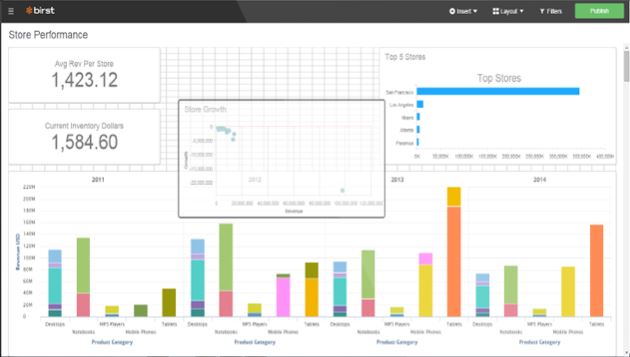
Consider this example: you’re part of a marketing firm that runs analyses and campaigns for multiple clients. You have great need for both regular, governed reporting on your company’s key metrics (mode 1) and also ad hoc answers to questions that come at the speed of business based on trends you see in your clients’ different promotions and their customers’ engagement with those assets (mode 2). Additionally, you’re a very lightweight organization already running many tools in the cloud, such as your CRM and sales tracking platforms. In this case, Birst would be an excellent fit because it would allow you to both quickly establish a standard framework for the core data that tells you the health of your organization and also enable fast, intuitive visualization and dashboard formats with great connectivity to a variety of data sources, giving you all you need to provide intuitive, presentable metrics to your clients around any questions they throw your way.
IBM Cognos Analytics
IBM Cognos Analytics is the newest redesign of IBM’s long-standing Cognos BI platform. With this latest release, IBM focused on providing business user enablement and agility as part of the same solution as its robust traditional reporting, ad-hoc querying, OLAP, and dashboarding capabilities. The tool provides a simple and intuitive user experience based out of a single authoring tool that can be customized to end users of all levels. The technology is still grounded in a governed metadata approach, which has always been a strong suit of the Cognos platform, but has significantly enhanced the ability for users to introduce and incorporate outside data into their analyses for both data discovery and ad-hoc analytic purposes. Many of the strongest features of IBM’s standalone visual data discovery product, Watson Analytics, were incorporated into Cognos Analytics, such as natural language querying, smart search capabilities, and automated data processing and modeling.
Cognos Analytics is very appealing in a context that requires airtight governance. For instance, if you’re part of an insurance company, you need to keep track of tons of regulations, covenants, risk factors, and geographical territories that can have a massive impact on your organization’s success if any piece of information is inaccurate. You need to ensure that your data is coming from vetted sources and that you can both consume and present it efficiently. Cognos Analytics’ combination of strong administrative, metadata modeling, and reporting capabilities make it an ideal solution for managing and adapting to complex, sensitive data sources and putting out visualizations that make that information accessible. Cognos Analytics also integrates very well with predictive analytics tools like SPSS Modeler and R, allowing you to run your actuarial findings and forecasts directly into a central analytics hub for consumption alongside actuals.
Microsoft SQL Server, SharePoint, Excel, and Power BI
Microsoft has dominated the BI market ever since the introduction of MS Excel – the go-to product for anybody dealing with any volume of data. They have built upon the pervasiveness of MS Excel and other common Microsoft solutions like SQL Server and SharePoint by continually introducing more robust BI capabilities into these products, as well as seamlessly integrating them with Power BI – Microsoft’s data visualization and dashboarding solution. The drawback of Microsoft as an enterprise BI solution is the number of technologies required to provide a full-scale modern BI platform encompassing both mode 1 and mode 2 capabilities. It is not uncommon, however, for organizations to already be leveraging the majority of these technologies for purposes outside of BI, and Power BI itself is one of the lowest cost per user solutions available on the market. Power BI doesn’t offer the advanced analytics capabilities of other platforms, and these tasks must be performed in Excel, with distribution of reports and dashboards taking place through Power BI’s cloud-based environment or SharePoint.
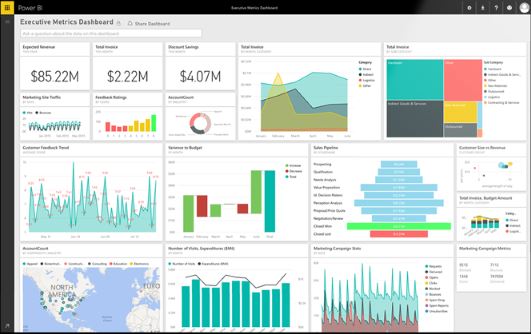
If you have a large user base that has a high degree of comfort with and access to Microsoft tools already (which many organizations do), crafting a combined BI solution from those tools is an attractive option. For example, if you were looking to start experimenting with BI and put a foundation of core processes in place at a small business, you could go a long way toward those goals with minimal learning curve/cost and also add compelling visualization capabilities by going with Microsoft.
MicroStrategy
MicroStrategy is a platform that combines strong enterprise features with governed data discovery, self-service data preparation, and big data exploration. One of the tool’s greatest strengths is in the ability to seamlessly productionize and promote business user authored content to enterprise use in both desktop and mobile formats, something other platforms require the use of different components of the technology to accomplish. MicroStrategy offers strong data visualization and exploration capabilities over large and complex data sets that can include both structured and unstructured data and can be augmented with open source visualizations brought in from the D3 library. It also includes several built-in advanced analytics functions, such as forecasting and trend lines, and readily integrates with leading predictive analytics platforms like SPSS, R, and SAS. Cost and difficulty of use are some of the limitations of this product, but it offers one of the most seamless integration experiences between mode 1 and mode 2 capabilities out of the BI tools listed here.
Because of its high degree of bimodal capability and versatile on-prem and cloud implementation options, MicroStrategy fits well in a variety of scenarios. One we’ve seen recently is a financial services company who selected MicroStrategy for its enterprise-level governance and scalability, its on-prem implementation options, and its data discovery capabilities that reconcile enterprise data against new sources and allow smooth promotion of new insights. This strikes a great balance for the financial services industry, as they need to quickly respond to shifts in market trends and new information, maintain rigorous data quality and information verification standards, and handle massive loads of structured, unstructured, and semistructured data.
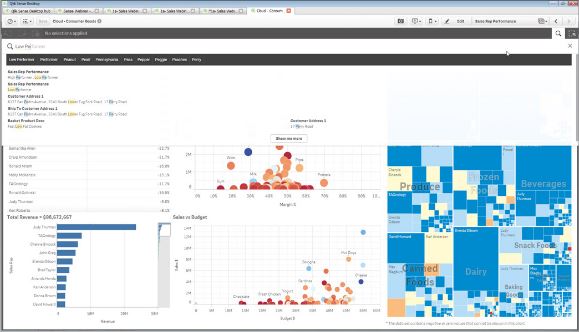
Qlik
Qlik offers an associative analytics engine that allows users to find patterns in their data that may not have been evident or achievable using SQL queries alone. The tool is highly rated by market analysts for its governed data discovery, ease of use, and complexity of analysis. Because it lacks capabilities in mobile, advanced analytics, scheduling, and collaboration, Qlik often needs to be supplemented with additional BI tools to attain full bimodal capabilities.
One great example of how we’ve seen Qlik used to supplement wider analytics activities is a technology manufacturer we recently worked with. We helped them use Qlik as a report output solution attached to an Apache Spark workflow we helped them build that brought in, crunched, and consolidated web logs from their corporate site to analyze traffic, especially download behavior. Qlik was the complementary piece of the puzzle they needed to easily connect to and visualize the data coming from their Spark notebook to make it consumable and actionable.
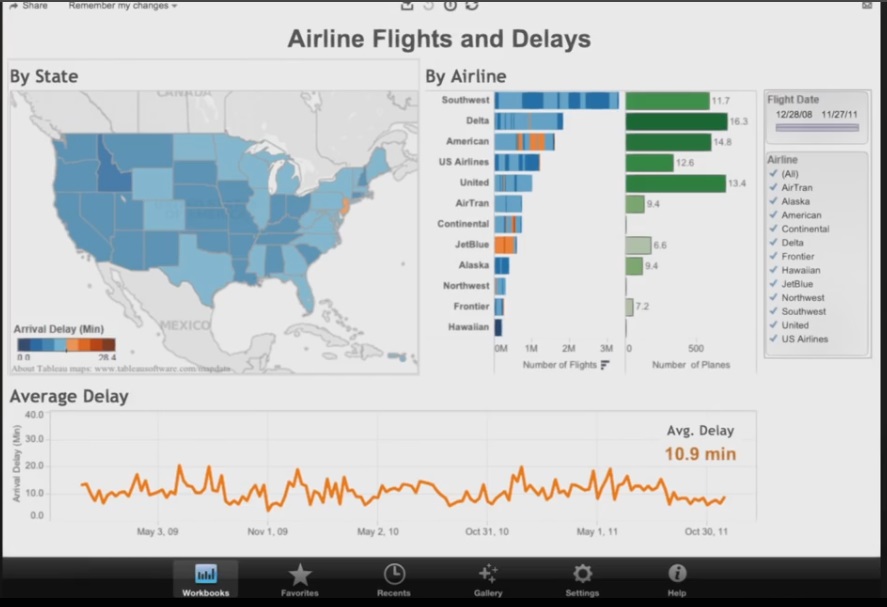
Tableau Server and Tableau Desktop
Tableau’s primary focus since being founded in 2003 has been on ease of use and providing the end user with access to the data that will drive insights. They have continually expanded upon their initial product to provide smart data preparation capabilities and support for metadata reuse, scheduling, and collaboration via Tableau Server. Tableau has one of the widest range of data connectivity options of the BI tools on this list, with native connectors for many relational databases as well as OLAP, Hadoop, NoSQL, flat file, and cloud sources. A strength of the platform is its data visualization capability, offering not only a wide array of visuals but also embeddable graphical design best practices to ensure that the data being analyzed is displayed in the most intuitive format for the greatest insight.
Like MicroStrategy, Tableau also works in a variety of contexts, both standalone as a bimodal platform with an emphasis on data discovery through Tableau Server and Tableau Online, its cloud-based counterpart, and as a data discovery supplement to a more mode 1 oriented BI platform. I’ve seen this use case in action recently, as my team and I have been working on an integrated environment at a health insurance provider that connects Cognos BI and Tableau to allow robust, enterprise-grade governance alongside flexible, ad hoc data discovery activities. With this system in place, both business and IT stakeholders will be able to get the information they need while also maintaining the standards necessary for their industry.
Where Do We Go from Here?
Of course, there are many other BI tools on the market, and you may find that your use cases are best suited to a more niche analytics solution not geared toward a bimodal approach. Below are several examples highlighting such use cases and the solutions that helped solve them.
- Domo for Marketing Analytics
- Spark for Data Prep and Machine Learning
- Manchester PD’s Predictive Policing Success
- 3 Ways Location Intelligence Is Already Part of Your Life
No matter what the use case may be, or even if you haven’t defined one yet but know that you need additional insight into your data, Ironside’s advisory services can help you navigate the process of selecting the right individual BI tool or set of BI tools to meet both your tactical and strategic needs. Our experts can put you in touch with the vendors that match your goals and priorities and help you evaluate them to find the best fit for your organization.