Top New Features in Tableau 10
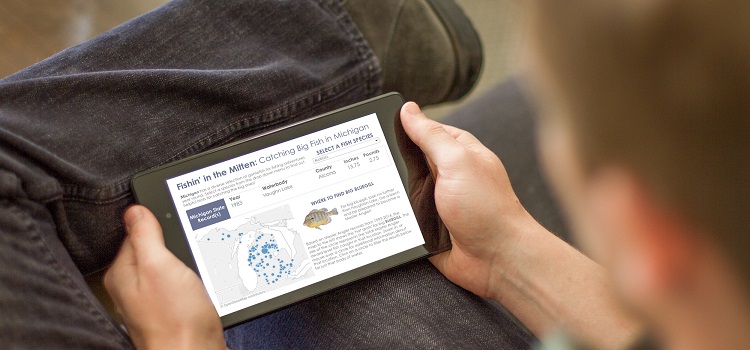
Tableau 10 was released on August 15th, and it is quite an upgrade. I’ve been spending some time doing hands-on testing of the new version, and I’m excited to share some of the new features I’ve explored with you.
In addition to a new custom font, new color palettes, and new themes that make Tableau more beautiful and visually appealing than ever, Tableau 10 has made great strides in bringing some of the most widely requested features from past releases into reality for this one. I’m going to walk you through some of the ones we at Ironside find most compelling and explain what the practical impact of each one is on the overall functionality of Tableau. This article will cover the following new features:
- Cross-database joins
- Filtering across data sources
- Device preview/device designer
- Cluster analysis
- Highlighting
- Maps and geography
- New data source connections
- Tableau Server updates
Getting Started with Tableau 10
Users are able to run multiple versions of Tableau on their machines simultaneously. I urge you to download the free trial of Tableau 10 so that you can experience the changes for yourself. One of the things we like here at Ironside about Tableau is its user friendliness and intuitive processes, which let you dive in and start experimenting without fear.
One thing to keep in mind as you get going: Tableau is forward compatible but not backwards compatible. You can open any workbook created in previous versions and Tableau 10 will automatically convert the file over. The caveat is that once upgraded, the workbook will no longer open in earlier versions, so if you’ll need the workbook in both 10 and an earlier release, be sure to keep separate copies of it.
Cross-Database Joins in Tableau 10
The moment we’ve all been waiting for is here! Tableau 10 finally allows users to join tables from different databases using the data source connections tabs. This is a critical feature that brings Tableau up to speed with other leading vendors in the space. To help users keep track of which database each table comes from, Tableau has implemented color-coded connections. In the image below, a table from Microsoft SQL Server (colored blue) has been joined with a table from MySQL (colored yellow).
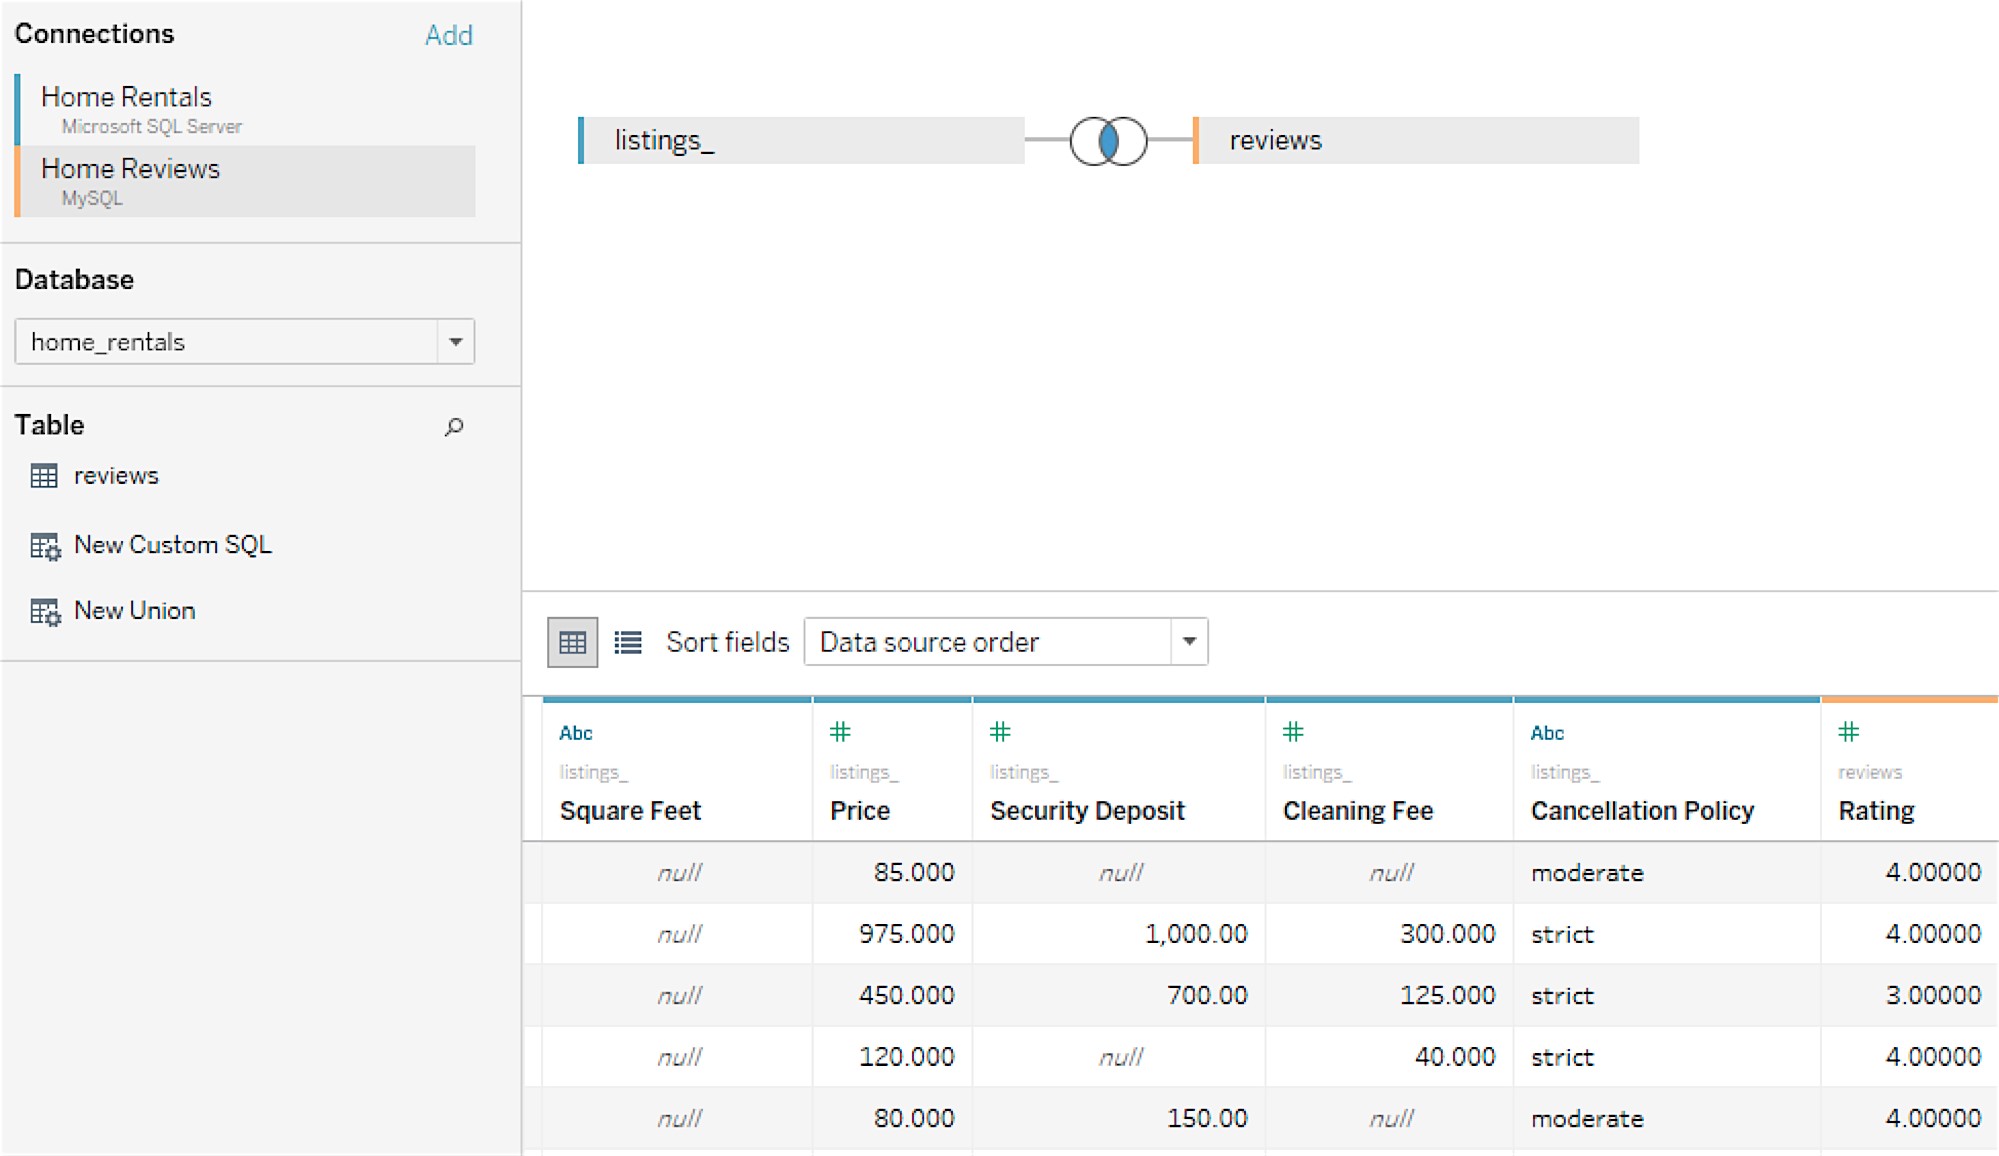
Source: tableau.com
In previous versions of Tableau, the only way to connect tables together from different database connections was to “blend” the data. In a blend between two databases, the join is always a left-outer join between the main table and the table that it is blended to. Additionally, in blends, row level calculations involving fields from different databases were not supported. This limited the amount of data manipulation you could accomplish when using multiple sources and negatively impacted performance through consistently querying more table rows than necessary.
The new cross-database join feature is a fantastic addition that now supports the ability to create an inner-join between databases will improve the performance of the workbook by only querying for the required rows. This new addition also adds support for row level calculations that use data from both databases. To illustrate why this matters, let’s explore a quick example.
Say you’re a clothing retailer that controls multiple brands headquartered in different locations with information stored on different databases. You need to do a competitive analysis to find out which brand is producing stronger jean sales. Using Tableau 10, you quickly pull relevant tables for the different lines of jeans from the two different databases where the brand information is stored. You then add a quick calculation in that divides one brand’s revenue totals against the other’s and just like that you’ve got a view into what percent of the second brand’s revenue the first brand achieved. You then drop this information into a visualization and present it to your board of directors, who decide their sales strategy around each brand accordingly.
Filtering Across Data Sources
Alongside the cross-database join functionality, Tableau 10 now also enables users to apply a single filter that spans across all related data sources. Prior to this release, if you created a data blend that related two databases on the field user-id, for instance, a separate filter for each database or a parameter would need to be used to filter across both. This added further processing strain to queries on top of the left-outer join issue.
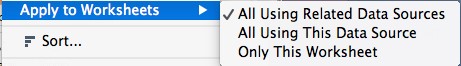
Now, users can instead choose to apply a filter to “all using related data sources,” as shown above, instead of filtering each data source individually or relying on parameters and filter actions that limit the presentation of the filter options. If we continue with our example from the last section, this would mean that in addition to bringing in and adding calculations to the different lines of jeans from your retail brands, you could filter on specific high priority styles to further narrow your results and could apply that filter across both data sources.
Device Preview/Device Designer
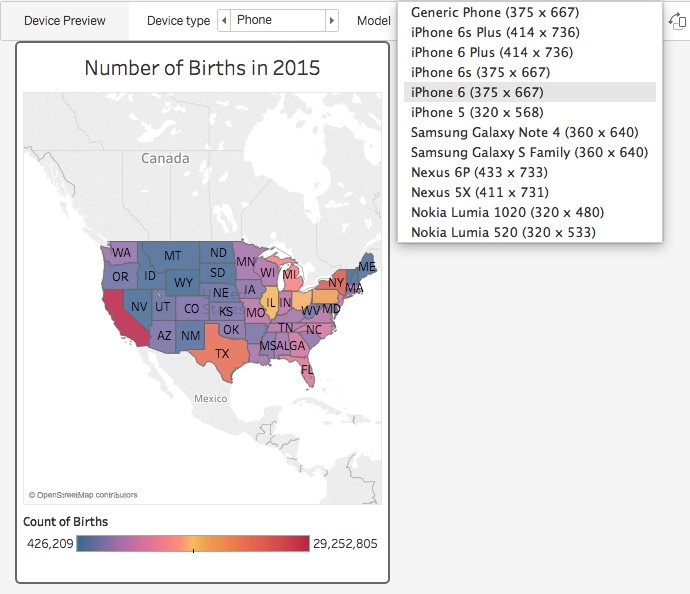
When in the dashboard layout, there is now a device preview button. This allows the developer to preview the layout over many different device types. When the user selects fit all, the dashboard will automatically scale to fit inside whatever device is currently selected in the device preview pane.
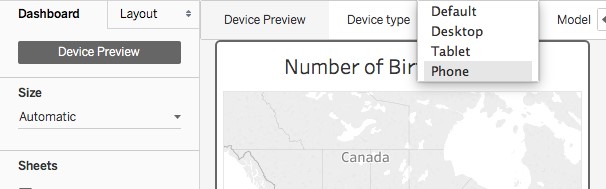
In the image below, the dashboard was automatically sized to fit comfortably for users viewing the dashboard on an iPhone 6, but as you can see that there are a variety of other options, as well as the ability to add your own custom layout size. This feature helps you optimize visualization and dashboard usability based on the audience viewing the asset you’re creating. For instance, if you’re providing regional sales numbers to a team of reps that are constantly on the go, designing your display with a phone or tablet format in mind would make the end result more efficient.
Prior to this update, the user experience on a mobile device was limited and clunky. Now dashboards can be automatically resized to optimally fit on a device of any size. This makes a big difference for anyone on the road and not at a computer who still needs to be updated with critical information. It also brings Tableau 10 closer to the mobile user experience standards of other leading vendors like MicroStrategy.
Cluster Analysis
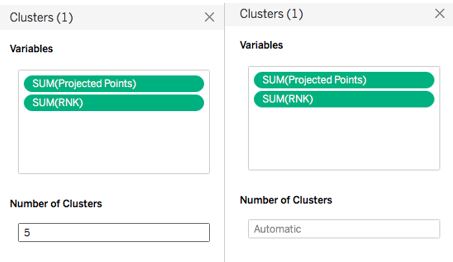
Tableau 10 has added a clustering function to the Analytics toolbar. The clustering function uses k-means to cluster the data set based upon the measures and dimensions that are dragged into the new Cluster Variables card. You can specify the number of clusters that you wish to have or you can leave the Number of Clusters field blank and Tableau default to the ideal amount. More detailed information about the statistics behind the clustering function can be found in Tableau’s online help.
Clustering data has a wide variety of uses in the data science/advanced analytics realm. For example, cluster analysis is often used for market segmentation so that companies can specifically target only those customers who are likely to be interested in a specific promotion. If the company is successful in their cluster analysis, this will be a win-win. The company will not waste resources sending coupons to uninterested parties, and the uninterested customers will not be bombarded with spam mail!
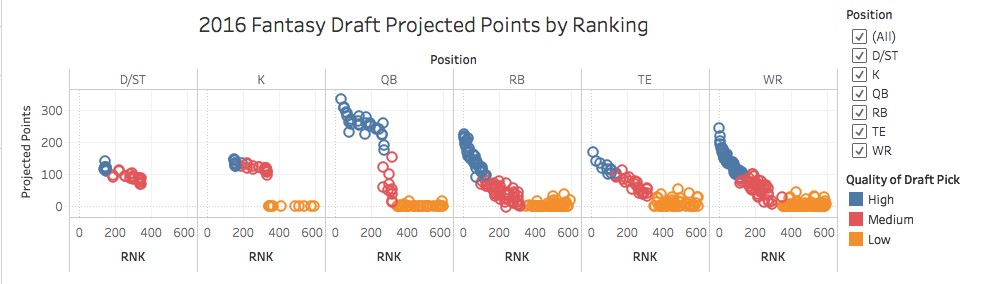
Cluster analysis can also be used for everyday tasks like drafting a fantasy football team. In the example below, I utilized rank and projected points for each player in the lead to cluster my data set into three clusters representing the quality of different draft picks.
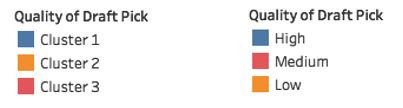
Once your clusters are created, you can then re-name them so that they are better related to your data.
Highlight Feature
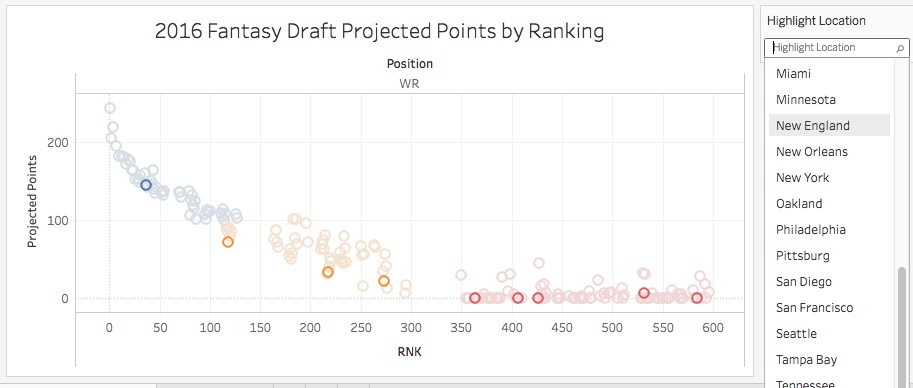
Let’s say you want to see how your favorite team’s wide receivers stack up to the rest of the available wide receivers. Tableau 10’s new highlight feature allows users to quickly visualize where the New England Patriot wide receivers fall within the larger group. At a quick glance, we can see that there is 1 high rated WR, 3 medium rated WRs, and 5 low rated WRs. Yikes! Perhaps it will be best to choose a WR from a different team! This is an extremely useful feature that will make exploratory analysis in Tableau even faster.
Maps and Geography
Working with international data? No problem! Tableau 10 now supports almost all of Europe and has also expanded into Asia and South America.
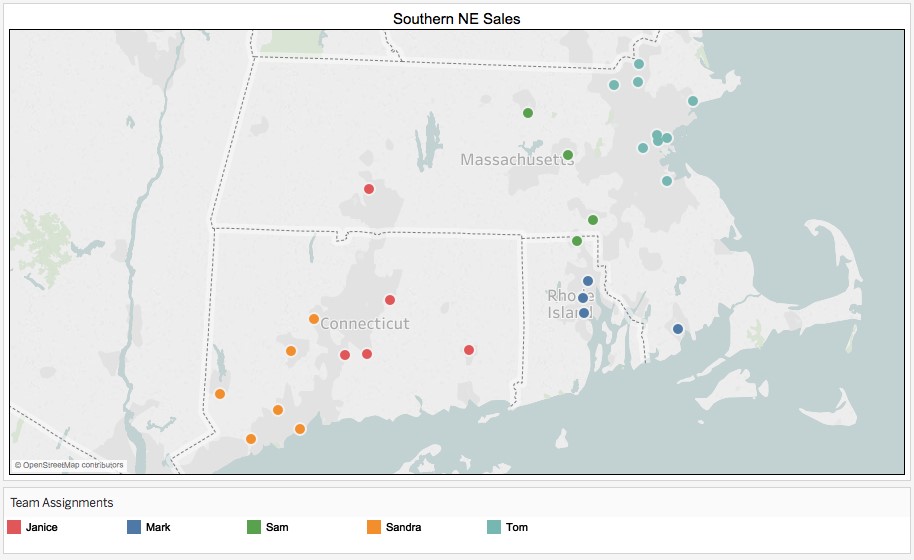
In addition to recognizing more geographical areas, Tableau 10 also now allows the user to roll up geographical fields into custom territories. For example, perhaps you have 5 sales representatives for Southern New England. You can now group by geographical fields to create unique territories.
New Connections
Tableau 10 has added a variety of new data source connection types. You can now connect to Google Sheets, Quickbooks, and many other commonly used sources. See the image below for the full list of supported connections.
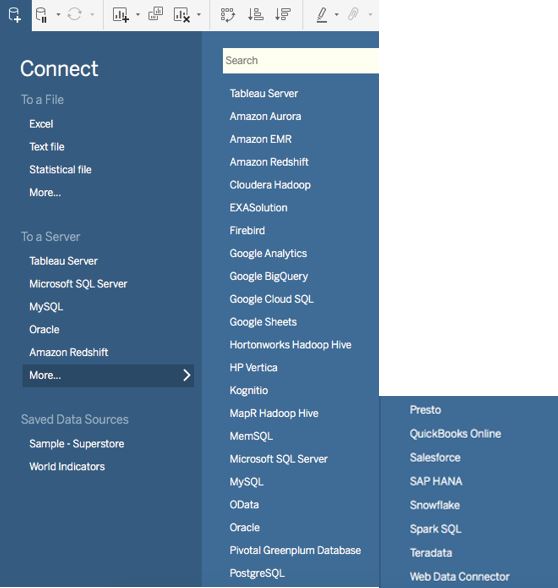
This further diversification of the Tableau connection portfolio combined with the stronger approach to merging and filtering multiple data sources we discussed earlier makes Tableau 10 more capable of handling a diverse landscape of information, such as what you’d find in a larger enterprise.
Tableau Server Updates
In addition to upgrades to the desktop tool, Tableau 10 also comes with many enhancements to its web authoring capabilities. Users can now add published data sources, create dashboards, format workbooks, blend data sources, highlight data, and create and edit table calculations all within the web interface. This enables users to operate more efficiently without using Tableau Desktop.
Updates like this on the Tableau Server side are important for building out the tool’s capabilities on an enterprise level. Tableau has historically been considered as a point solution for business users who need quick answers to questions on the fly. However, their efforts around continuing to develop a more robust centralized option where multiple users can contribute and administrators can oversee development and data quality means Tableau 10 is becoming more viable for larger implementations as well.
Conclusion: Where Tableau Is Heading
Since its release in 2003, Tableau has slowly and methodically proven itself as a prominent self-service data discovery tool. With the new features released in Tableau 10, it is evident that Tableau plans to continue to expand further into user-driven mode 2 analytics to reach a wider user base while also working to appeal to those focused on IT-driven mode 1 initiatives as well. This is a strong step to take, indicating a real concern for reconciling the arguments between governance and data discovery that have come up from Tableau use in the past at organizations.
The device preview functionality doesn’t quite bring Tableau up to the pixel perfect capabilities of competitors like IBM Cognos and MicroStrategy. However, it certainly is a step in the right direction, and pixel perfect was never Tableau’s priority anyway. The product’s main concern has always been fast, consumable results, and the latest release strikes a strong balance between that core goal and the added robustness that comes from stronger governance and data management functionality.
Tableau has realized that not everyone wants to (or needs to) learn how to code to conduct data science explorations. While the cluster analysis and forecasting features are limited in comparison to SPSS or R, the simple drag-and-drop interface allows users to quickly forecast or cluster their data to obtain a general sense of its trends/groups. In many cases, a basic model is really all that’s needed to drive a business decision or justify a deeper dive by a specialized team.
In addition to making strides to enter the data science realm, Tableau has stepped it up a notch with regards to their data connection availability and multiple database querying functionality. These improvements not only boost Tableau’s performance, but also open the doors to more users who previously were unable to link their datasets directly to Tableau. We expect Tableau usage to continue to grow in the upcoming quarters.
Tableau is still lacking as a data cleaning tool and doesn’t yet support many ETL functions. Currently, users are better off transforming data outside of the tool and connecting to clean data sets. We hope to see improvements around this area in the future.
Need to know more about how you can use Tableau 10 in your organization? Ironside is a Tableau partner, and if you talk to us about your core goals and challenges, we can show you the use cases that will best fit your needs.
Ironside also provides Tableau training. Our instructors can get you up to speed on the latest updates and show you the practical techniques you’ll need to be effective in Tableau on a daily basis.