Tag Archive for: Data Visualizations
https://www.ironsidegroup.com/wp-content/uploads/2018/05/bigstock-Industrial-robot-with-conveyor-191083657.jpg
350
750
Ironside Group
https://www.ironsidegroup.com/wp-content/uploads/2018/03/logo-with-words.png
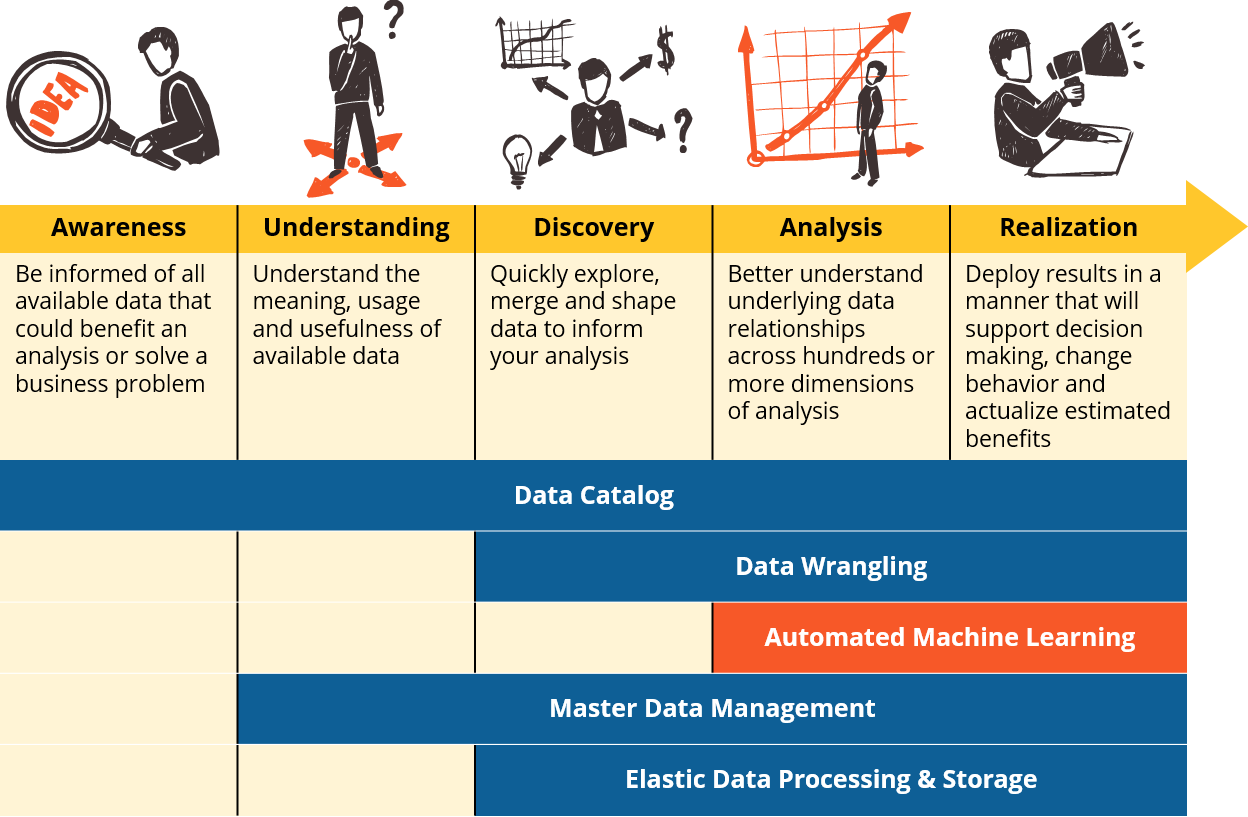
Ironside Group2018-06-06 09:14:442019-01-28 09:12:31Five Essential Capabilities: Automated Machine Learning
https://www.ironsidegroup.com/wp-content/uploads/2017/05/Dashboard-Warning.jpg
350
750
Ironside Group
https://www.ironsidegroup.com/wp-content/uploads/2018/03/logo-with-words.png
Ironside Group2017-05-01 21:35:552019-03-18 09:51:17Words of Warning: 5 Dangerous Dashboarding Terms
https://www.ironsidegroup.com/wp-content/uploads/2017/03/Team-Discussing-Computer-Output-Resized.jpg
350
750
Ironside Group
https://www.ironsidegroup.com/wp-content/uploads/2018/03/logo-with-words.png
Ironside Group2017-03-29 17:04:422019-01-22 12:23:35Purposeful Persona Building: Design Thinking Part 2
https://www.ironsidegroup.com/wp-content/uploads/2017/01/Planning-Strategy-Sticky-Notes-Resized.jpg
350
750
Ironside Group
https://www.ironsidegroup.com/wp-content/uploads/2018/03/logo-with-words.png
Ironside Group2017-01-05 14:38:112019-01-22 11:52:343 Reasons to Start Your Upgrade from Cognos BI to Cognos Analytics Right Now
https://www.ironsidegroup.com/wp-content/uploads/2016/10/Tableau-Conference-Crowd-Concept-Resized.jpg
350
750
Ironside Group
https://www.ironsidegroup.com/wp-content/uploads/2018/03/logo-with-words.png
Ironside Group2016-10-31 09:26:042018-07-12 16:05:32Navigating Tableau Conference 2016: An Interview with Crystal Meyers and Katelyn Tolbert
https://www.ironsidegroup.com/wp-content/uploads/2016/09/Tableau-Tablet-Viz-Resized.jpg
350
750
Ironside Group
https://www.ironsidegroup.com/wp-content/uploads/2018/03/logo-with-words.png
Ironside Group2016-09-15 11:58:042019-01-22 12:51:30Top New Features in Tableau 10
https://www.ironsidegroup.com/wp-content/uploads/2016/06/Tableau-Desktop-Resized.jpg
350
750
Ironside Group
https://www.ironsidegroup.com/wp-content/uploads/2018/03/logo-with-words.png
Ironside Group2016-09-07 08:08:552019-01-22 12:51:50Ironside and Tableau Partner to Power Data Discovery
https://www.ironsidegroup.com/wp-content/uploads/2016/06/Cheering-On-Mountain-Resized.jpg
350
750
Ironside Group
https://www.ironsidegroup.com/wp-content/uploads/2018/03/logo-with-words.png
Ironside Group2016-09-07 07:37:162019-01-22 12:52:27Empowering Insight with Tableau: A Case for Self-Service Analytics
https://www.ironsidegroup.com/wp-content/uploads/2016/07/Microphone-with-Audience-Resized.jpg
350
750
Ursula Woodruff-Harris
https://www.ironsidegroup.com/wp-content/uploads/2018/03/logo-with-words.png
Ursula Woodruff-Harris2016-08-16 11:45:192018-07-13 16:34:19Social Media Analytics: Unlocking Your Audience
https://www.ironsidegroup.com/wp-content/uploads/2016/06/Domo-Executive-Dashboard-Resized.jpg
350
750
Ironside Group
https://www.ironsidegroup.com/wp-content/uploads/2018/03/logo-with-words.png
Ironside Group2016-06-06 10:19:542019-01-22 12:54:00Ironside and Domo Partner for Flexible Self-Service Analytics