Tag Archive for: Cognos

What is Natural Language Query?

Natural Language Query is the ability to use natural language expressions to discover and understand data and accelerates the process of finding answers that data can provide. Another way to think about it would be a translation mechanism that helps bridge the gap between technical and non-technical users who may not understand which database has the data, which field to use or how to create calculations to answer their questions.

An example might be “How many customers made a purchase this month?” And the idea is that the tool would respond and give you answers and visualizations that answer that question or at least help you on the path to finding it.

From an industry perspective, in 2017, Gartner predicted that by 2020 half of all analytics queries will be generated using natural language processing. As of 2021, we have seen all of the leading vendors in the analytics space adding functionality like this and many have had this functionality for 2+ years.

Tableau – Ask Data

Tableau released Ask Data in version 2019.1 (February 2019) and has continued to enhance and improve its functionality. To use Ask Data, simply navigate to the desired data source in Tableau Online or Tableau Server, type in a question and Tableau will answer that question in the form of an automatically generated visualization. From there, you can customize the visualization, add additional filters and save your analysis as its own report. Ask Data will also recommend questions based on your data source and offer suggestions to refine your question as you’re typing. 

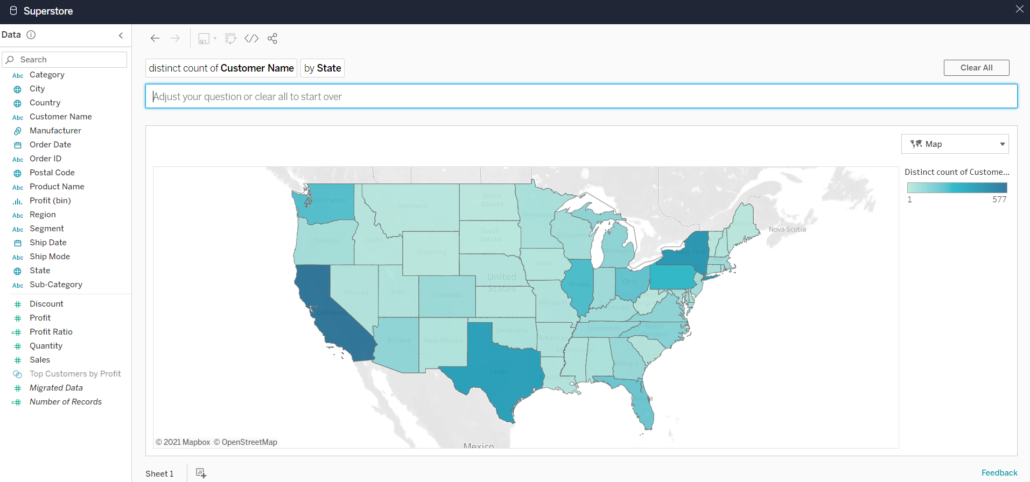
Another feature of Ask Data is the ability to create synonyms for fields so similar terms can be mapped to an existing field. If your business users are used to referring to customers as clients, you can add the word client as a synonym for the customer field in order for Ask Data to interpret the word client. For data source owners and Tableau administrators, Ask Data provides a dashboard that displays the most popular queries and fields, number of visualization results that users clicked, etc. to understand habits and behaviors of those using Ask Data with a given data source.

Power BI – Q&A

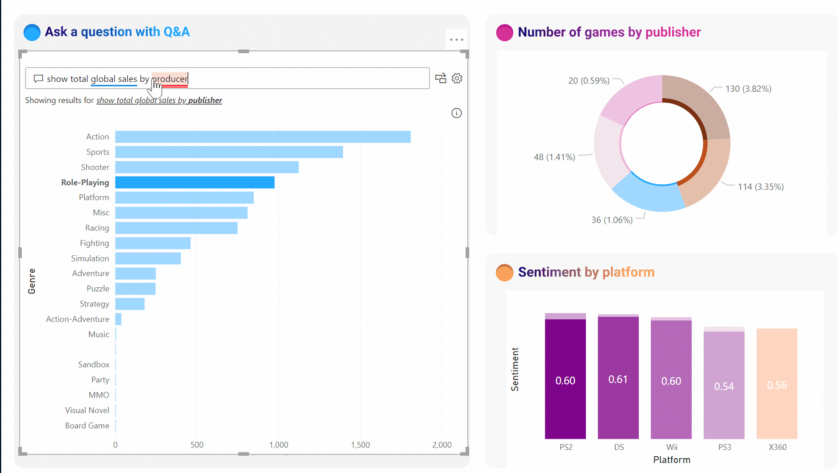
Power BI’s natural language query tool, Q&A, was released in October 2019 and is available in both Power BI Service and Desktop. In Power BI Service, Q&A is available in the upper-left corner of your dashboard. Similar to Ask Data, you can type in a question and Power BI will pick the best visualization to display your answer and if you’re the owner of the given dashboard, you can pin the visualization to your dashboard. It’s important to note that Q&A will only query datasets that have a tile on the dashboard you’re using so if you remove all the tiles from one dataset, Q&A will no longer have access to that dataset. To use Q&A while editing a report in Desktop or Power BI Service, select “Ask a Question” from the toolbar and type your question in the text box that appears.

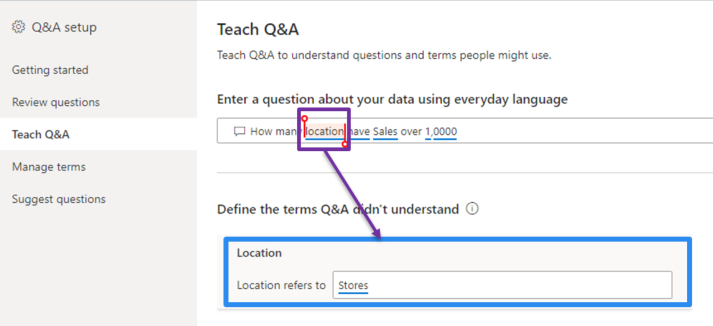
Teach Q&A is a feature that allows you to train Q&A to understand words it doesn’t recognize. For example, someone asks “What are the sales by location?” but there is no field called “location” in the dataset. Using Teach Q&A, you can indicate that location refers to the region field and moving forward, Q&A will recognize that location means region.

Cognos Analytics – AI Assistant

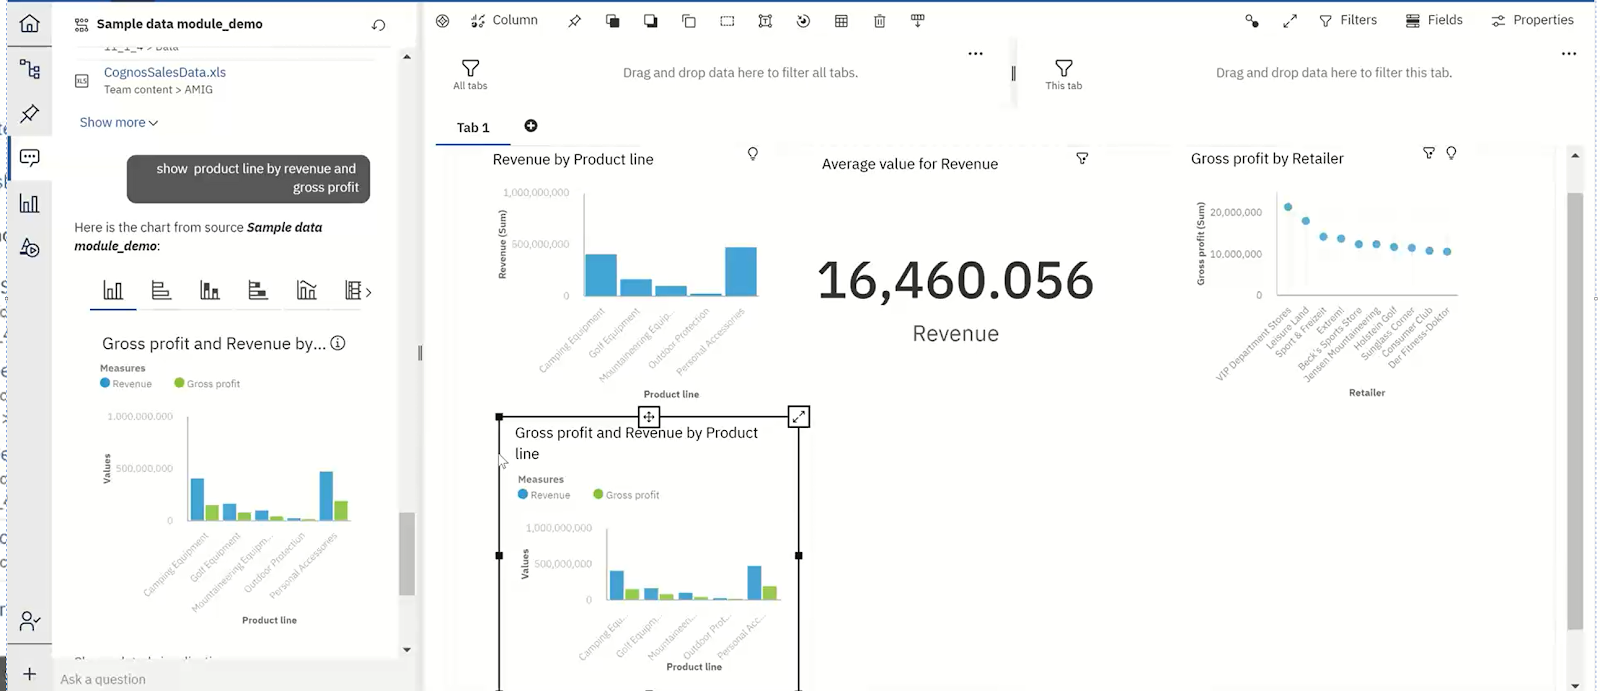
AI Assistant was released in version 11.1 in September 2018 and can be used to explore data in Dashboards and Stories. AI Assistant is available by clicking the text bubble icon in the Navigation panel. Unlike the tools mentioned above, the AI Assistant interface appears more like a chat window where your conversation history is saved. You ask a question about the data, receive an answer, then can continue asking additional questions and scroll back in the history to view the whole “conversation”.  After asking a question, the AI Assistant will respond with an auto-generated visualization, that you can customize if desired, and then drag onto your dashboard canvas. 

Amazon QuickSight – Q

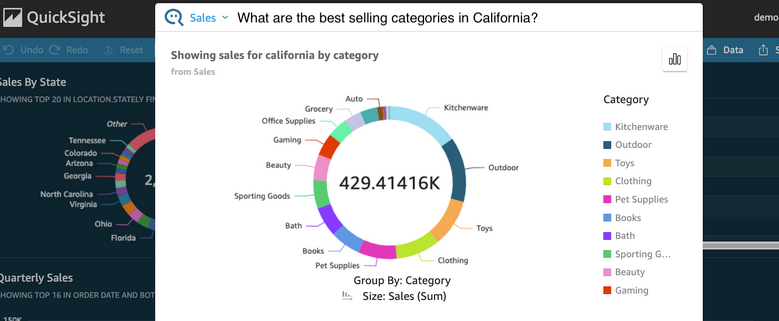
Amazon QuickSight, the newest of the tools discussed, released a preview of their natural language query tool, Q, in December 2020. Like the tools mentioned above, Q is a free-form text box found at the top of your dashboard where you can specify the data source you want to explore and ask your question. If Q does not sufficiently answer your question, you can provide feedback to correct the answer and that feedback is sent to the BI team to improve or enhance the data.

Overall

Tableau – Ask DataPower BI – Q&ACognos Analytics – AI AssistantAmazon QuickSight – Q
Release DateFeb 2019Oct 2019Sep 2018Dec 2020
Suggests Questions
Create Synonyms
Auto-Generates Visualizations
NLQ User Log

Overall, these tools are all similar in how they are used/function and all have the same goal – to make it easier and faster for business users to get answers from their data.

This blog post originated from our Take30 session around Natural Language Query, presented by Ursula Woodruff-Harris, Scott Misage, & John Fehlner.

For users of IBM Cognos Analytics a popular request is to highlight alternating rows in a report. This article will demonstrate how to achieve this result using the list container and the property Conditional Styles.

In order to create the report, the following objects will be used:

Object Definition
List containerContains report data
Query CalculationsCreate calculations
Running-count() functionGet sequential numbers
Mod() functionGet remainders of 0 or 1
List columns body style ancestorAncestor object used to highlight the data
Conditional stylesCreate type of style

Finished Product

When the demo is finished your report will look similar to the following:

Let’s get started.  The first thing we’ll do is create a simple list report using the sample GO Sales (query) package included with the application.  However, you can use any data to follow along.  

Create the query calculation

  1. Select the blank template and create a report using the List container. 
  2. From the Sales(query) namespace add the Product number, Product and Revenue data items to the list.
  1. View the report in Page Preview.
  1. From the Toolbox, add a Query Calculation to the end of the list container next to Revenue.  The Data item expression dialog will open. Name the calculation Count
  2. Click the Functions tab at the bottom of the screen.   
  1. Open the Summaries folder and double click the running-count() function to add it to the expression.  This function returns the running count by row for a set of values.
  1. Click the second tab on the dialog box, Data Items , and drag the Product Number to the function.  Add the ending parenthesis.

Running-count(Product number)

  1. Click OK to view the results.

The result of the running-count() function will show sequential numbers on each row.

Create Values to Highlight

The mod() function returns the remainder of two numbers.  In our case it will generate the numbers 0 or 1 after the division takes place.  

We will nest the mod() function around the running-count() function to achieve this result.

  1. Double-click the Count column title to return to the Data item expression.
  2. Modify the expression as follows.

mod(running-count([Product number),2)

  1. Click OK when done to view the report.  Note the position of the parentheses and the divisor is 2.  Even numbers will have a remainder of 0 and odd 1.

Note:  the mod()function is available for selection, however, we are typing the expression to ensure the correct syntax is applied.

The results of the calculation show 0 and 1 on alternating rows. 

 Apply Conditional Formatting

We will now highlight the rows in the list object using the List Columns Body Style ancestor. A row with the value of 1 will be colored.

  1. Click any column in the List container and at the top of the Properties pane or on the flyout menu select the ancestor object and click List Columns Body Style.  When selected the area will highlight in the list.

2.  From the Properties pane double click the Conditional Styles property.  The Conditional Styles dialog box will appear.  Click the plus sign (+) and select New Conditional style > Count. Click OK.

  1. Click the plus sign (+) to add a threshold value of 0 and click OK.  In the Style column click the first edit button (pencil) and select a Background color. Click OK.  Note the arrow next to the 0 is pointing upward indicating the color will generate for values greater than 0. Click OK to exit all dialog boxes.
  1. View the report.

5.  Since the Count column is not needed in the report remove it using the Cut button (scissors). Do not delete the column as it is used in the calculation used to render the conditional formatting and must remain in the underlying query.

As you can see, alternating row colors in a list report is simple in IBM Cognos Analytics!

Happy reporting! 

For the original version of this blog post using IBM Cognos Workspace Advanced, click here.

The world has changed dramatically over the course of a single month, and companies are struggling even more with things that have historically challenged them:

  • Finding the best people to run, build and innovate on their analytics tools and data
  • Making these environments accessible to employees in a work-at-home model

In this Forbes article, Louis Columbus cites a recent Dresner survey that shows up to 89% of companies are seeing a hit to their BI and Analytics budgets due to COVID-19. The survey includes these two recommendations:

Recommendation #1

Invest in business intelligence (BI) and analytics as a means of understanding and executing with the change landscape.

Recommendation #2

Consider moving BI and analytical applications to third-party cloud infrastructure to accommodate employees working from home.


89% of companies are seeing a hit to their BI and Analytics budgets due to COVID-19.


We’re here to help you explore your options.

Now that the role of analytics is more important than ever to a company’s success, analytics leaders are again being asked to do much more with much less — all while companies are experiencing staff reductions, navigating the complexities of moving to a work-from-home model, and struggling to onboard permanent hires.

To address these short-term shortages (and potentially longer-term budget impacts), companies are naturally evaluating whether leveraging a managed-service approach — wholly or even just in part— can help them fill their skills gap while also reducing their overall spend.

As they weigh this decision, cost, technical expertise, market uncertainty and the effectiveness of going to a remote-work model are all top-of-mind. Here’s how these factors might affect your plans going forward:

Factor 1: Cost

As the Dresner number showed, most analytics teams need to reduce spend. Doing this mid-year is never easy, and usually comes at the expense of delayed or canceled projects, delayed or cancelled hiring, and possibly even staff reductions. All of these decrease a company’s analytics capabilities, which in turn decreases its ability to make the right business decisions at a critical time. A managed services approach to meeting critical analytics needs, even just to address a short-term skills gap, can provide valuable resources in a highly flexible way, while saving companies significant money over hiring staff and traditional consulting models.

Factor 2: Technical Expertise

A decade ago, your options for analytics tools and platforms were limited to a handful of popular technologies. Today even small departments use many different tools. We have seen organizations utilizing AWS, Azure, and private datacenters. Oracle, SQL Server, Redshift all at the same company? Yes, we have seen that as well. Some of our customers maintain more than five BI tools. At some point you have to ask: Can we hire and support the expertise necessary to run all these tools effectively? Can we find and hire a jack-of-all trades?

In a managed services model, companies can leverage true experts across a wide range of technology while varying the extent to which they use those resources at any particular time. As a result, companies get the benefit of a pool of resources in a way that a traditional hiring approach simply cannot practically provide.

Factor 3: Effectiveness of Remote Work Engagement

If you weren’t working remotely before, you probably are now. Companies are working to rapidly improve their processes and technologies to adjust to a new normal while maintaining productivity.

Managed service resourcing models have been delivering value remotely for years, using tools and processes that ensure productivity. Current events have not affected these models, therefore making them an ideal solution for companies  trying to figure out the best way to work at home.

Times are changing. We’re ready!

Ironside has traditionally offered Managed Services, to care for and maintain customer platforms and applications, and consulting services, to assist in BI and Analytics development.

Companies can leverage our Analytics Assurance Services temporarily, for a longer period of time to address specific skills gaps, or to establish a cloud environment to support remote analytic processes.

With Ironside, you can improve your data analytics within your new constraints, while reducing your costs. We’d love to show you how.

Contact us today at: Here2Help@IronsideGroup.com

This year’s IBM Insight conference has been chock full of many exciting announcements so far, including news about the next version of Cognos BI – Cognos Analytics.

Scheduled for general release by the end of 2015, Cognos Analytics promises an improved total experience for the entire analytics community from the business user to the IT developer, delivering enhanced usability focused on bringing together self-service and governance, two areas often thought to be incompatible. Cognos Analytics aims to change that perception by addressing both the increasing pressure for self-service and the critical need for governance in one elegant and intuitive enterprise-ready platform. Read more

The Preferred Syntax to use in Cognos and Why

Cognos is not a programming language, but it does allow programmable syntax such as a case or an if logic statement.  The question is, which is the preferred syntax to use and why?

Generally speaking, the answer is that it does not matter.  The best one to choose should be based on your brain’s ability to write and perceive the code one way or another.  The best application, however is to use them as follows: Read more

Even if you don’t have access to the RAVE visualizations available in Cognos 10.2.1, there are still some options to produce non-standard charts and simulate things such as heat maps using older Cognos versions. With some creative HTML use, you can set up a heat map that responds to various conditions in your reports. This article will discuss how to implement this structure. Read more