Tag Archive for: RAVE
https://www.ironsidegroup.com/wp-content/uploads/2014/08/Shopping-Cart-Resized.jpg
350
750
Ironside Group
https://www.ironsidegroup.com/wp-content/uploads/2018/03/logo-with-words.png
Ironside Group2014-08-28 15:07:212018-07-16 10:01:34Ironside Webinar Series: Consumerizing Enterprise Analytics
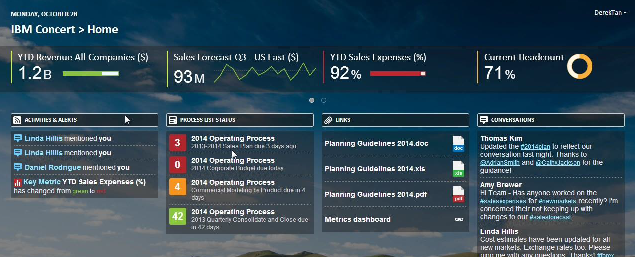
https://www.ironsidegroup.com/wp-content/uploads/2013/10/RAVE-example.jpg
350
750
Ironside Group
https://www.ironsidegroup.com/wp-content/uploads/2018/03/logo-with-words.png
Ironside Group2013-10-30 15:02:042019-01-22 13:26:43Ironside Webinar Series: An Introduction to IBM Cognos 10.2.1 Rapidly Adaptive Visualization Engine (RAVE)
https://www.ironsidegroup.com/wp-content/uploads/2013/07/Visualize.jpg
350
750
De Hsieh
https://www.ironsidegroup.com/wp-content/uploads/2018/03/logo-with-words.png
De Hsieh2013-07-09 10:49:562019-01-22 13:28:22Introduction to Using RAVE Visualizations in Cognos 10.2.1 Active Report