Database Structure in IBM Cognos Warehouses
A Cognos report is only as good as its data. How that data is organized will affect performance, accuracy, and ease of authoring. There is no single solution — before you get can your data right, you need to know how it is going to be used.
Know Your Requirements
In an ideal world, databases would produce the data for any kind of report with equal speed and ease. Unfortunately, this is not the case. Business Intelligence queries, in particular, frequently push the envelope of what databases can be expected to deliver. In order to keep performance acceptable, design compromises need to be made. Usually, this means making certain types of queries faster at the cost of making all other queries slower. If the faster queries are the ones the users care about, then the compromise will be a success.
For example, imagine a company seeking financial reporting on large volumes of data (hundreds of millions of individual transactions) based on customer and reporting period (month). There is a database which holds these transactions, but running reports against that database will result in poor performance. For each report, the totals of each of those transactions will need to be totaled. If the data were to be restructured into a summary table, with the amount for each customer in each period pre-totaled, the same reports could be produced much more quickly. However, this summary table would be useless for other types of reports (reporting on a daily basis, or by type of order, etc.). This is the compromise.
|
||||||||||||||||||||||||||||||||||||||||||||||||||
|
Detailed Data |
|
||||||||||||||||||
|
Summarized Data |
Structure Your Data
There are two main methods of structuring data in a warehouse, each named after one of its main creators/supporters: Ralph Kimball (aka Kimball-style warehouses) and Bill Inmon (Inmon-style warehouses).
When most people think of a data warehouse, they are thinking of a Kimball-style warehouse. Kimball warehouses are constructed with dimension tables and fact tables, organized into a “star schema”.
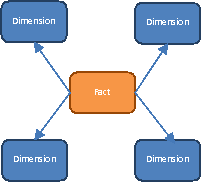

Kimball warehouses are useful for analytic reporting: summarizing large volumes of measurements (amounts, hours, etc.) and categorizing them (by type, customer, date, etc.). They are built in a similar structure as an OLAP database, which makes it simple to load data into an OLAP cube (such as TM1 or Hyperion). Cognos also works well with this structure.
Reports based around a single fact or set of measurements are very easy to write. (As reports need to go into more and more fact tables, they can become much more complex to write.)
The main drawback to a Kimball warehouse is the cost and effort required to create it. The Kimball format is designed for reporting, and most data is stored in a format designed for transactions (adding, editing, deleting). A data modeler must design the warehouse structure based on the data and the reporting requirements. Next, ETL (Extract, Transform, and Load) must be designed and developed to move the data into the warehouse and into this new format. This level of effort means that Kimball-style warehouses are mainly used for targeted analytic solutions. While it would be possible to put all parts of a business’ data into such a warehouse, it is rarely worth the effort.
(With Cognos, it is also possible to use Framework Manager to make a “virtual data warehouse” without any actual ETL; however, this is not recommended as it can result in significant performance issues.)
An Inmon-style warehouse looks more like a traditional database. It has a lot of tables, with each representing a different business entity. These tables can be joined in a complex web of relationships.
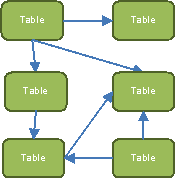

Inmon warehouses are useful for detailed reporting where the specifics of each item and the relationships between those items are of the highest importance. Because the warehouse is organized in the same way as the source systems, it’s easy for business users to understand and write reports about particular business entities. All of the details regarding a given item are easily available. Where Kimball-style warehouses focus on analytic summaries, Inmon warehouses can contain the finer details that might be lost in those summaries.
Much less work is required to create an Inmon-style warehouse than to create a Kimball-style warehouse. Since the data structures are similar between the source and the warehouse, copying the data into the warehouse requires much less design and development time.
The main drawback to an Inmon style warehouse is its potential complexity. The network of connections between different tables can be very complex, and can require a lot of business and reporting knowledge to use effectively. (In the hands of a sophisticated report writer, this complexity can be used to great advantage.) Also, as the data is generally not optimized for space, reporting on large volumes of data can take a lot of time.
When creating a Framework Manager model with Inmon-style warehouses, there is a high risk of running into loop joins (where tables are linked to each other in a circular relationship). Creating table aliases (“role-playing dimensions”) and dividing the presentation and business layers into multiple subject areas can help prevent this. If there are complicated relationships between tables, it’s often better to let the report writer handle any joins that go beyond a single subject area.
Don’t Forget the Requirements!
These two methods (Kimball and Inmon) of organizing data each have their uses. Neither should be used unless the reporting requirements require it. Understanding the uses to which data will be put is the key to any successful reporting project.