Exploring Weather with Watson: Public Data Powered Part 1

Public data is everywhere, and if you know where to look, you’d be surprised at the insights it can give you. In fact, when paired with the right tools, this freely available information can enrich and complement your internal data resources to reveal compelling patterns of behavior and trends that you can act on to drive growth at your organization. To showcase what public data can do in the hands of professional analysts, we’re kicking off the Ironside Public Data Powered article series. These publications will periodically take you behind the scenes to show you how our consultants think about and interact with public data using the skills and technologies at their disposal. In this inaugural article, we’ll explore what it takes to start understanding patterns and relationships within a combined public and internal data set through IBM Watson Analytics.
For this scenario, we’re taking on the role of a product manager working at a fictional wholesale sporting goods company. This manager has seen all the press and advertising about Watson Analytics and would like to understand if they can leverage the “freemium” Watson Analytics offering to help them quickly understand the relationship between weather and their historical sales to retailers across the United States.
To get started, we need to create a Watson Analytics account (https://apps.admin.ibmcloud.com/manage/trial/watsonanalytics.html). This will allow us to upload data sets into Watson Analytics and save any analyses we create.
After our Watson account is up and running, we need to gather the data we want to explore. For this project, we need a data set that represents our domestic sales metrics. We’ll gather data from the fictional employer’s Sales Mart, the GoSales data set, to meet this requirement. We’ll also include several other important pieces of information alongside the main data set, including product line, product type, order method, color, size, etc. by date for the year 2010.
To add in the weather aspect of this analysis, we can leverage some freely available data from the NOAA’s (the National Oceanic and Atmospheric Administration ) Quality Controlled Local Climatological Data data set. You can download this information from NOAA’s National Climatic Data Center at the link below:
http://www.ncdc.noaa.gov/data-access/quick-links#loc-clim
The NOAA download provides 28 different weather metrics (Average Temp, Average Max Temp, Average Min Temp, Average Dew Point, etc.) by month by WBAN (Weather Bureau Army Navy) station. Daily historical weather details are also available, as are a vast array of other weather-related metrics.
As there isn’t a WBAN station for each of the more than 42,000 zip codes in the US, we can leverage zip code areas (the first 3 digits of a zip code) to arrive at regionally representative weather metrics. We will relate the zip code area of the WBAN station to the zip code area of the retailer to understand the historical weather metrics impacting our retailers.
As a final step before uploading the data to Watson Analytics, we need to bring these three data sets together, relating historical sales metrics to regional zip code area and regional zip code area to historical weather metrics for the same time range. To accomplish this, I leveraged Microsoft Access to combine the data and save it in CSV format for uploading to Watson Analytics. You can use this tool or something comparable to manage this part of the process. As long as the final result comes out in a CSV file so Watson can recognize it, you’ll be all set to go.
Now that we have our combined data set, we can log in to Watson Analytics and upload it.
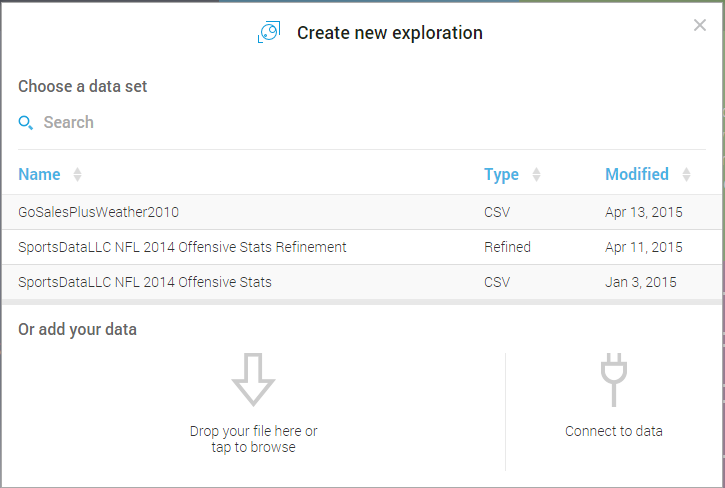
To upload the data set, simply click Explore and drop the data file into the dialog box shown below:
After Watson Analytics quickly uploads the data, it presents us with several sample questions to help guide our exploration:
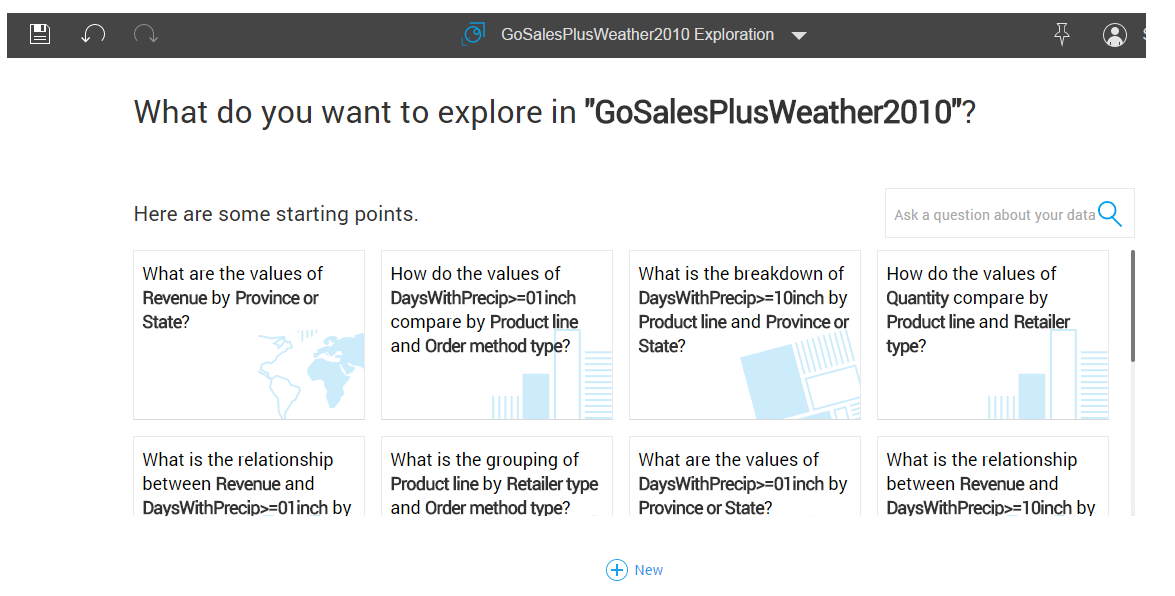 In this case, we’re initially interested to know the relationship between precipitation and the quantity and types of products our Retailers are ordering, so we’d click on How do the values of DaysWithPrecip >= 01Inch compare by Order Method Type and Product Line?
Watson Analytics then provides a huge variety of insights based on this data set and perspective:
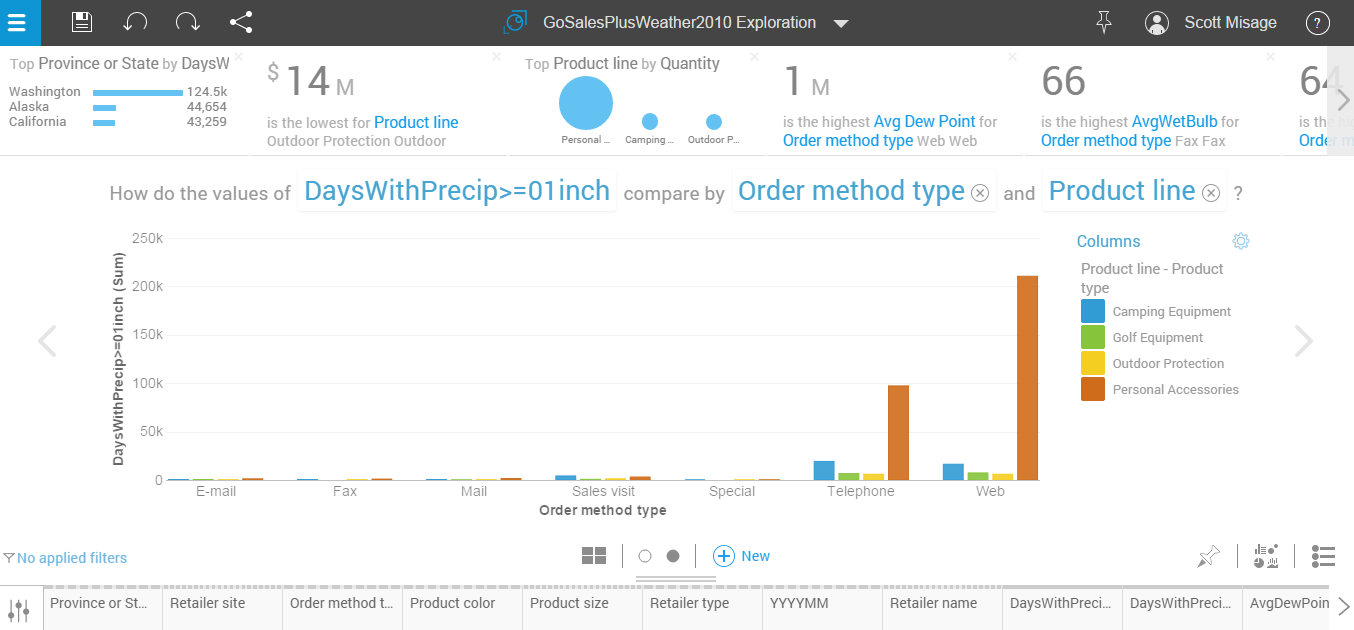
We can quickly see that there appears to be a strong relationship between the sales of Personal Accessories via the Telephone and Web order methods and periods of precipitation.
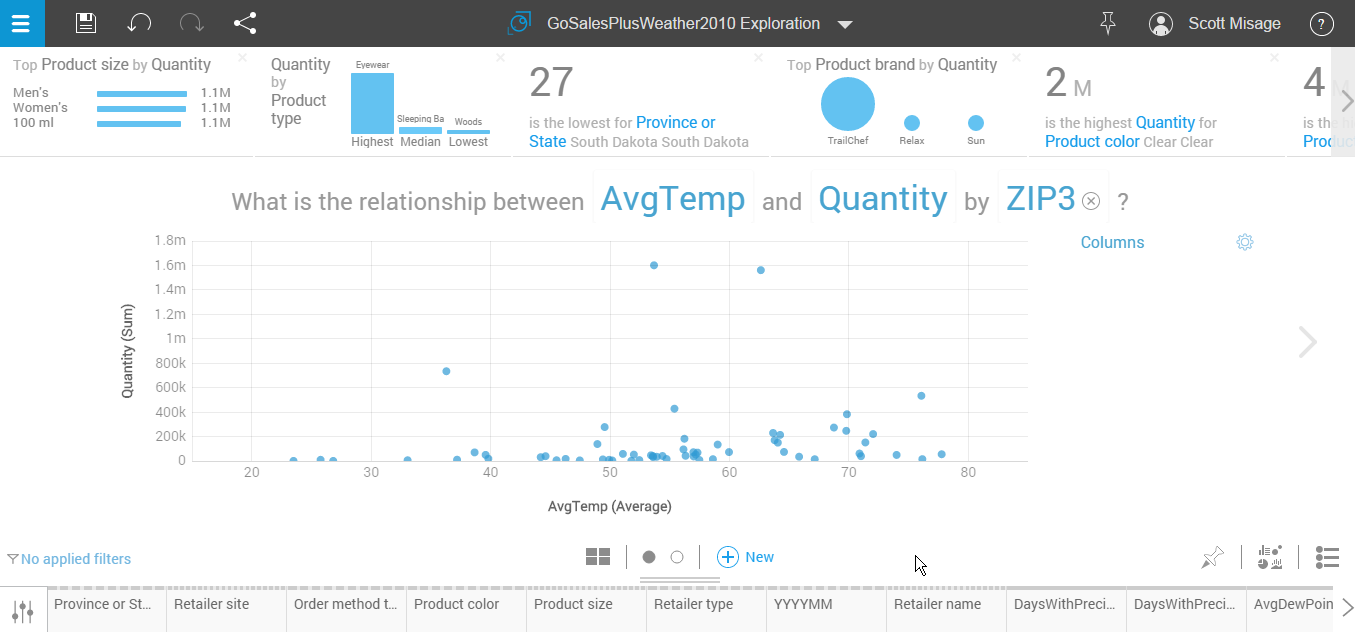
Watson also gives us a number of other relationships and observations across the top of the interface that help us understand other possible insights within the data set. Using these recommendations, we can quickly and easily begin to review other relationships, such as the relationship between Average Temperature and Quantity by Zip Code Area.
In summary, by using a collection of data from various sources, including in-house data and freely available sources of weather metrics, we’re able to quickly begin to understand relationships between historical sales and weather through the use of Watson Analytics.
Stay tuned for future articles in which we’ll perform additional explorations into this data and understand how we can start to predict how weather and other factors can impact the sales of our products.
Watson Analytics is just the beginning of a much larger analytics journey. It’s a quick and easy way for anyone curious about a public, internal, or combined data set to establish some initial areas of interest that they can then refine through more targeted development efforts. With access to the right knowledge and tools, you can leverage the massive amounts of publicly available information around you to assess the probability of future events, arrive at recommended courses of action to preempt trends in your industry, and add new levels of robustness to your data preparation efforts.
If you’d like a partner and advisor to put you on the road to success with these powerful and innovative analytics strategies, contact Ironside today. We’d be happy to combine your business information with relevant public assets to put you on the leading edge in your space.