Rolling Forecasting Starter Kit: 3 Essential Facts

Many organizations have adopted monthly or quarterly rolling forecasting as a primary tool for understanding their operational and financial performance. The rolling forecast is a process that includes the continuous evaluation of past results with future expectations across a set number of time periods to analyze trends and help the organization understand its current position.
One of the most effective ways to leverage existing data is to predict and re-evaluate future financial performance on a regular basis as new values come in. Unfortunately, many companies’ finance departments still remain too busy with day-to-day activities and closing the books (monthly, quarterly, yearly) to make time for a monthly reforecast. Fortunately, with the right approach, modern financial planning applications let you to develop forecasting modules that expedite rolling forecast creation and minimize the number of people involved while still preserving accuracy. In this article, we‘ll review three major facts that are true of the successful rolling forecast modules we’ve seen.
1. Flexible Basis
Most financial departments fear the amount of time required to populate a rolling forecast. Charts of accounts are usually elaborate, and tracking down individual accounts on monthly basis is an unwelcome challenge for financial teams and an unaffordable time luxury for financial leadership. To address these concerns, a financial system administrator can set a centralized forecast base that applies to all accounts. Usually, there are three main options when setting this up – Actuals, Prior Forecasts, and Budget. Of these options, using an extended set of Actual periods (18 months) is the most efficient way to build an accurate forecast. Some examples of the Actual basis sets may include:
- Prior Month: Last month’s actuals used as the basis for all future months’ forecasts
- Prior Quarter: Last quarter’s actuals
- YTD: Sum of current year’s actuals
- Prior Year: Sum of prior year’s actuals
- Prior 12 months: Sum of the prior 12 months’ actuals, rolling forward each month
The idea behind this basis is using historical averages to build forward-looking fluctuations. Did a business model change over the last month, leading to a value substantially different from its predecessors? If this is the case, “Prior Month” would be the most appropriate basis. Are you in the middle of the year and would only like to utilize actual values from January 1st of the same year? For this scenario, the YTD option would suit your needs best. Flexibility is key in creating a number of temporary forecasts to evaluate side by side so you can choose the most appropriate one.
2. Centralized Spreading
In order to minimize the manual input associated with a rolling forecasting, a centralized module that enables spreading – the ability to select a single value and apply it across multiple cells in a cube – is critical to successful rolling forecast implementation. While many tools provide out-of-the-box spreading functionality, it‘s still very time-consuming to go through the chart of accounts, right-click on every row, decide on the spreading type, and choose an underlying forecast basis. To speed up forecast creation, it’s better to have a centralized spreading module that lets users pick a spreading methodology and to apply it either to an individual account or a group of accounts (up to the entire chart of accounts). This spreading methodology would also include a built-in forecasting type (Flat, Seasonal, Trending, etc.), a basis, and a percentage increase or decrease to apply (manual user input).
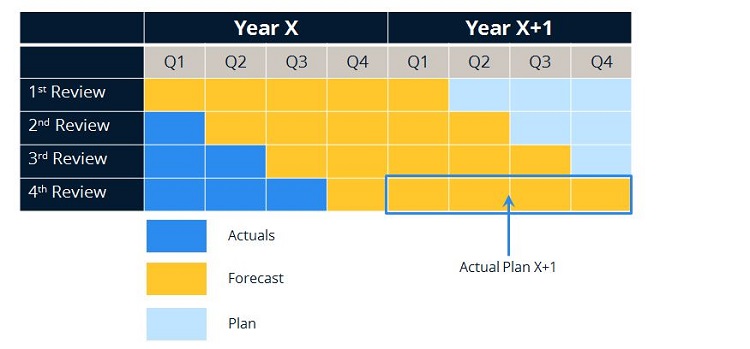
3. Updated Actuals
It’s rare that you can tie the opening of a new forecasting month to a specific calendar date, which means it’s essential for a forecasting module to allow the designation of a specific period as the first forecast period in a new cycle. All periods prior to the first forecast period become populated with actuals and are used in the forecasting templates to blend actual data (usually prior 12 months) with forecasting data (usually 18 months). This then serves as a clear representation of an organization’s financial performance over a 30-month cycle, enabling better analysis, easier trend recognition, and, as a result, faster discovery of lagging areas requiring intervention.
Conclusion: Next Steps for Rolling Forecasting
These three key elements will help you quickly develop a rolling forecast that continuously incorporates actual values with very little time investment from the business team, improving accuracy and providing a better view of the future outcomes for the company. You can even automate your rolling forecasts to further minimize the time you spend maintaining them. Ironside has a suite of objects available that are designed with all these elements in mind. We can help you substantially expedite the development of a robust forecasting application that’s quick to deploy and accurate with its insights.