Tabbed Reports in Cognos 10.2.2: The New, Easy Way to Make Clean, Consumable Multi-Page Reports

In Cognos 10.2.1 and earlier versions, the phrase that most accurately described a multi-page report was “wrestling match.” Long list reports would flow on for page after page until somewhere along the way you ran into that chart you knew you added but were starting to forget about. Defining page breaks helped some, but following the flow of a multi-page report was often a tiresome process that left your mouse hand cramped from clicking Page Down. With the release of Cognos 10.2.2, IBM changed all that with tabbed reports.
Now, with a few simple clicks, you can set up a horizontally tabbed multi-page report that allows rapid movement between the different pages you define and easy comprehension of the divisions between those pages. Using tabs, you can set up aesthetically pleasing and diverse data presentations that convey the different facets of your mission-critical information from a single location. Once you see their easily navigable interface design and clearly labeled components, we’re sure that tabbed reports will quickly become your go-to method for crafting the most effective multi-page reports possible. Want to see how? Let’s take a look.
Step 1: Set Up your Pages
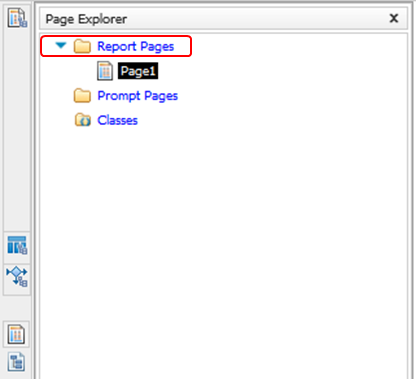
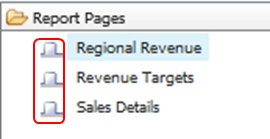
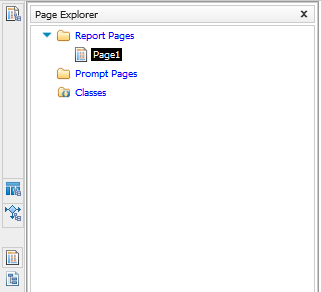
In most environments, when you create a new report in Report Studio you automatically begin with a single page showing the data container and package you chose on startup. To quickly add more pages to this base report, hover over the Page Explorer and click the Report pages folder, as shown below.
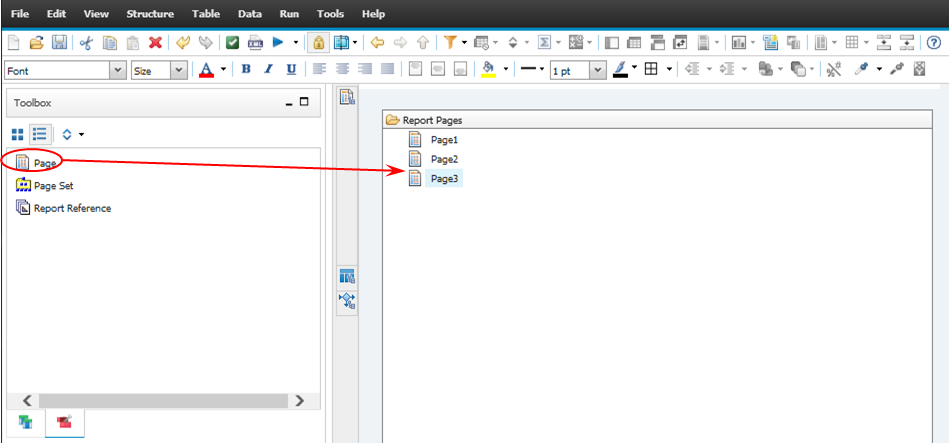
Clicking the folder takes you to Report Studio’s page design area, the location from which you can add more parts to your report such as page sets, report references, or, in our case, just extra pages. Drag a couple Page objects from the Toolbox tab to the Report Pages list to add them.
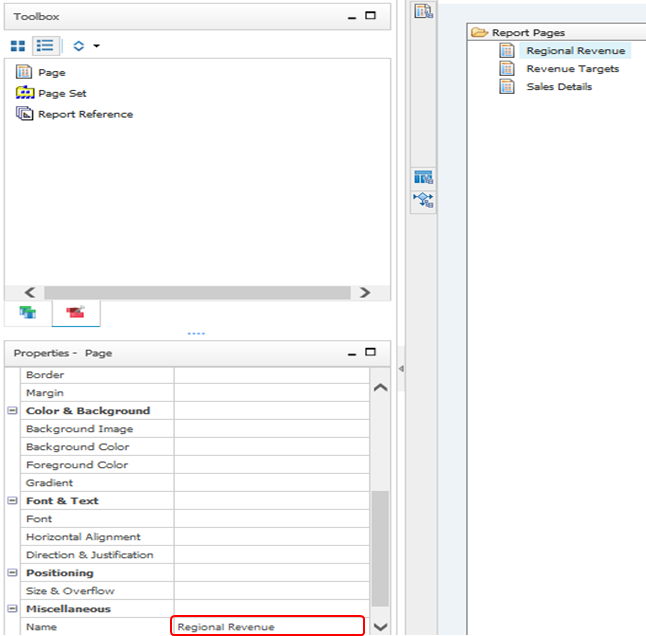
At this stage, it’s always important to name your pages specifically so that you can easily remember what should appear on each one as you build out your report structure. To do this, select a page in the Report Pages list and change the Name field under Miscellaneous in its Properties pane to contain the name you want to use.
Step 2: Design Page Content
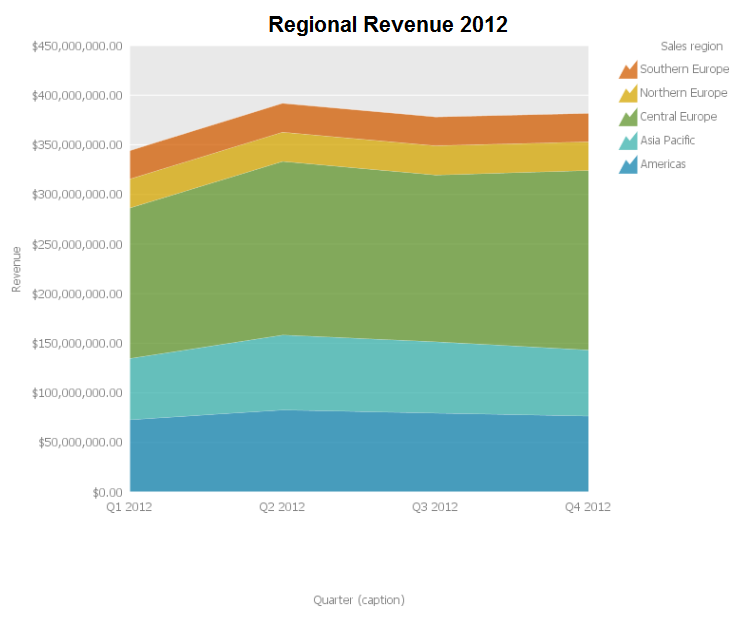
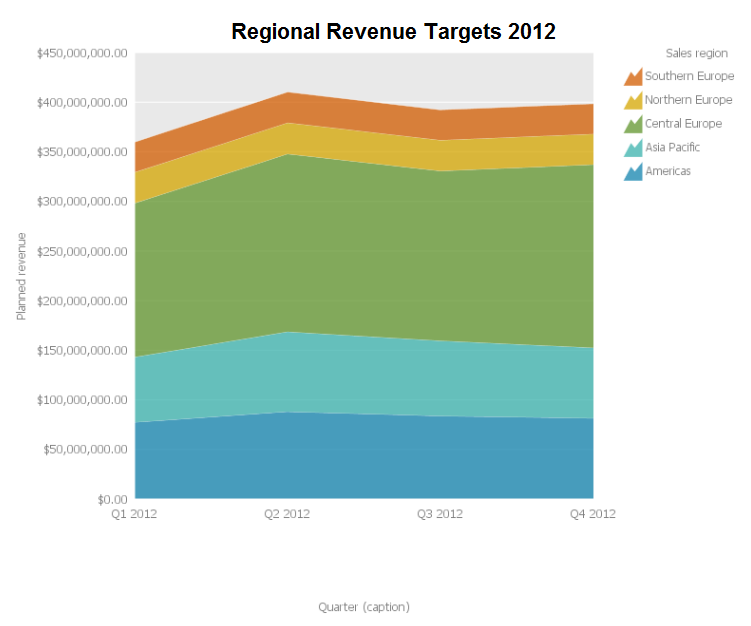
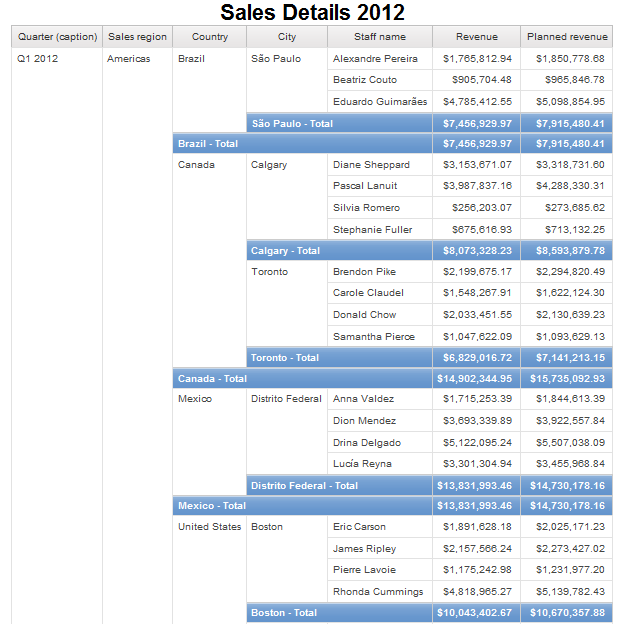
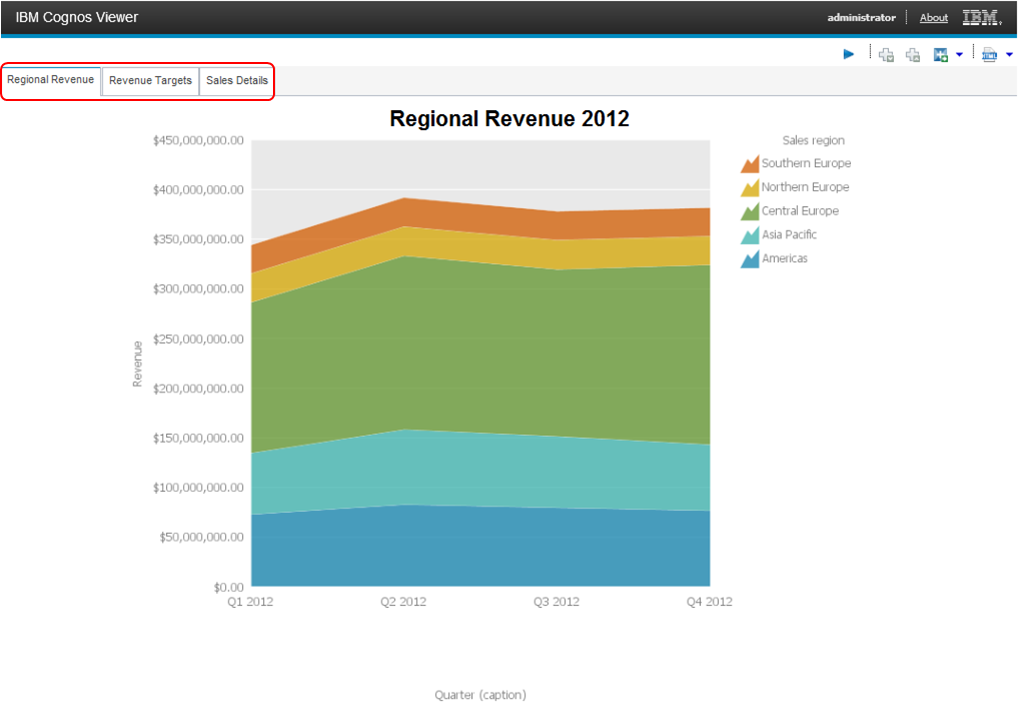
After you have all the pages you want in your report created and named, you’re ready to fill them with the report content you plan to present. In the page examples below, I’ve created two visualizations that give quick insight into how each region’s revenue is performing when compared against the targets set for the year and a detailed list that breaks those numbers down to the sales reps in each area. This will allow viewers to understand the overall trend of the data while also giving them the option to dive deeper.
Page 1 – Regional Revenue
Page 2 – Revenue Targets
Page 3 – Sales Details
Step 3: Convert to Tabs
With your content designed, you can now switch back to the Report pages folder and change your pages over to tabs. From the main menu, click File > Report Properties. This will bring you to a dialog box that contains overall styling options for your report. If you expand the View pages as tabs dropdown, you will see the two format options available for tabbed report output: Top left and Bottom left.
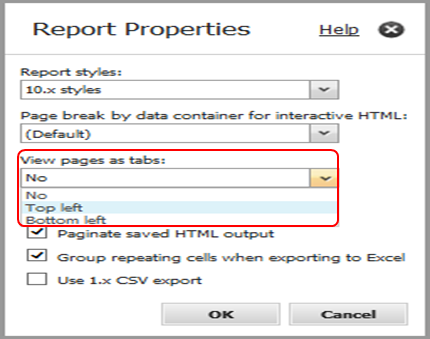
Select a tabbing option and click OK. You should see the icons for your pages change to look like miniature tabs. This is how you know you’re ready for tabbed report presentation.
At this point, you’re ready to enjoy the fruits of your labor and run your report. Instead of the usual first page format showing only your first report and forcing you to scroll down for more information, you will see tabs showing the names of your pages at the location you specified in Report Properties. Using these, you will be able to easily flip back and forth between the different report pages you constructed, quickly drawing important conclusions from your data and greatly reducing your time to actionable intelligence.
If you’d like to know more about tabbed reports or any of the other new features in Cognos 10.2.2, Ironside is here to help! Please get in touch with us to see how we can help you achieve your organization’s goals. Also, to get a quick idea of what’s most important about 10.2.2, check out our recent article showcasing the top 10 enhancements IBM made this time around.
