Tag Archive for: Analytics

Midmarket companies use Advanced Analytics and AI to automate processes, glean strategic insights and make predictions at scale such as:

  • Marketing – What is the next best offer for this client? 
  • Customer churn – Will this customer churn soon?
  • Predictive maintenance – When will this machine or vehicle fail?
  • Insurance- Will this person file a large claim?
  • Healthcare – Will this person develop diabetes?

Companies can wait until their competitors, or new entrants leverage AI in their industry, or they can start the process now.  There’s no doubt that the coming years will see AI applied to ever-increasing processes in the organization.  The urgency is to start reaping the benefits before widespread adoption in your industry occurs. 

The good news is that midmarket companies are still in the early stages of large-scale deployment of AI projects.  A recent survey by Corinium Intelligence (Data Leadership: Top Cloud Analytics Mistakes – and How to Avoid Them) found that only 4% of respondents say their advanced analytics models and self-service tooling are fully scaled and integrated with business processes across the organization.

However, midmarket companies are actively scaling and experimenting with AI and Advanced Analytics in their business processes.  The survey found that 53% are creating MVPs (Minimum Viable Products) and 36% are in the process of scaling advanced analytics and AI, well on their way to deployment.

AI adoption will transform business models over 2-5 years. The time to start is now.

What challenges do midmarket companies face as they define, build and deploy Advanced Analytics and AI technologies in their companies?

The Corinium Intelligence survey asked mid-market companies about the biggest mistakes they saw or experienced in deploying Advanced Analytics and AI.  This survey of 100 data and analytics leaders from the financial services, insurance, telecoms, retail, and manufacturing sectors highlights the challenges enterprises face at each step of the data modernization journey – from designing the right data architecture to incorporating AI in business processes for competitive advantage.

59% of respondents cited inadequate data and compute infrastructure as the leading impediment.  Choosing the right technologies, hiring the right skill sets and proactively investing in change management are the next three sources of mistakes on the path to utilizing the AI/Advanced Analytics. 

Choosing the wrong analytics or AI technology solutions can result in setbacks later on. It’s important to carefully consider the various analytics and AI solutions that are available and choose the one that best meets the needs of the organization.

Successful analytics and AI projects require a range of technical and domain-specific skills. 54% of survey respondents said it was important that the necessary skills and expertise are available within the organization, or that they can be acquired through training, hiring and partnering.  In fact, many mid-tier companies bring in external expertise to implement AI and advanced analytics.

Almost half of the respondents identified failure to invest in change management as another risk. Analytics and AI projects can involve significant changes to processes. It’s important to proactively identify cultural and organizational success factors.  This includes getting executive buy-in, aligning analytics and AI strategy with business goals and communicating the value of analytics and AI projects to the rest of the organization, in order to build support and ensure successful adoption.

The stakes are high.  The mistakes leaders cited led to significant or total disruption of Advanced Analytics and AI strategies.  These challenges can delay realizing the business benefits, delay advantages against competitors or hamper defending against new entrants who use Advanced Analytics and AI.

What are the options when building a world class advanced analytics and AI capability in my organization?

Three paths that companies follow include:

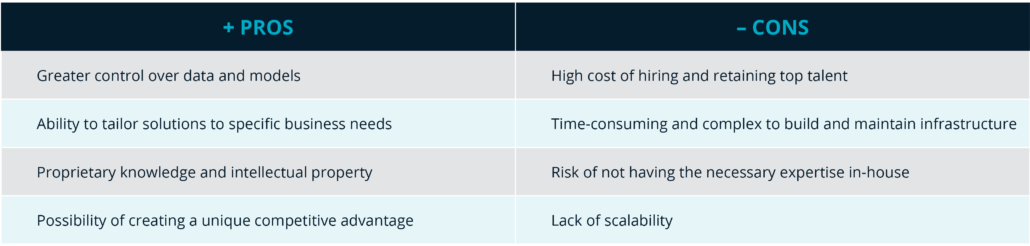
1. Build the capability in-house

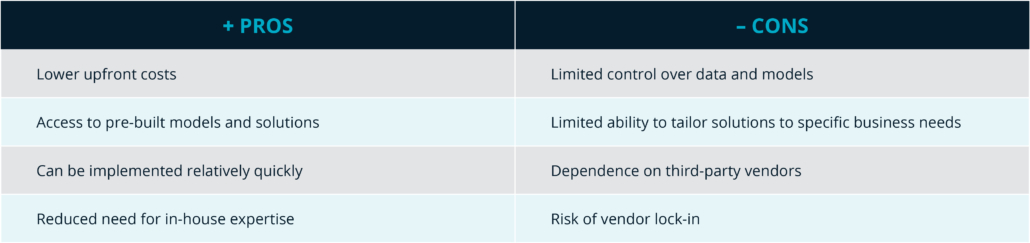
2. Buy third-party solutions

3. Partner with cloud consultants to accelerate customized advanced analytics/AI solutions

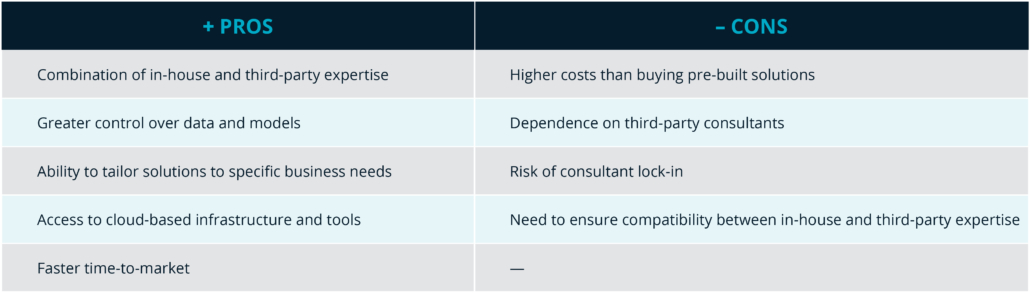
In summary, building Advanced Analytics/AI in-house offers greater control and the ability to tailor solutions to specific business needs, but it can be costly and time-consuming. Buying third-party solutions is quicker and less expensive, but it offers less control and limited ability to tailor solutions. Partnering with a cloud consultant can be a good middle ground as it provides a combination of in-house and third-party expertise and the ability to tailor solutions to specific business needs, but it is more expensive than buying pre-built solutions. Whichever path you choose, the benefits of advanced analytics and AI are well within your reach.

Take a look at the full whitepaper to learn more: Data Leadership: Top Cloud Analytics Mistakes – and How to Avoid Them

Contact Ironside Group today to accelerate your Advanced Analytics and AI Strategies.

Your data needs are different from those of any other client we’ve worked with. Plus, they’re ever-changing. 

That’s why we’re fluid in our approach to creating your framework and why we ensure fluidity in the framework itself. 

Diagram

Description automatically generated

Whether your current investment in assessments, governance, and technology is heavy or light, we can meet you where you are, optimize what you have, and help you move confidently forward. 

These steps are all necessary, but don’t happen in a strict sequence. Each of them is an iterative process — taking small steps, looking at the results, then choosing the next improvement. You need to start with assessment and governance — unless you already have some progress in those areas. 

Analytics are constantly evolving, and the Modern Analytics Framework is designed to evolve more readily as users discover new insights, new data, and new value for existing data. There will be constant re-assessment of the desired future state, modifications to your data governance goals and policies, design of data zones, and implementation of analytics and automated data delivery. Making these changes small and manageable is a key goal of the Modern Analytics Framework.

Can we ask you a few questions?

The better we understand your current state, the better we can speak to your specific needs. 

If you’d like to gain some insight into how your organization can move most effectively toward a Modern Analytics Framework, please schedule a time with Geoff Speare, our practice director.

Geoff’s Calendar
GSpeare@IronsideGroup.com
O 781-652-5758  |  484-553-1814

Get our comprehensive guide.

Learn about our proven, streamlined approach to taking your current analytics framework from where it is to where it needs to be, for less cost and in less time than you might imagine.

Download the eBook now

Check out the rest of the series.

In the same way that Software as a Service eliminates the need to install applications on your local network, Data as a Service lets you avoid storing and processing data on your network. Instead, you can leverage the power of cloud-based platforms that can handle high-speed data processing at scale. Combine that with the ready availability of low-cost cloud storage, and it’s easy to appreciate why so many organizations are turning to Data as a Service. 

Graphical user interface

Description automatically generated with medium confidence

One key component of a modern analytics framework.

In Ironside’s Modern Analytics Framework, Data as a Service is one of 3 key components.

Diagram

Description automatically generated

How can Data as a Service serve your organization?

We know your time is valuable. So, let us speak to your specific needs. 

Schedule a time with Geoff Speare, our practice director.

Schedule a time with Geoff Speare, our practice director:

Geoff’s Calendar
GSpeare@IronsideGroup.com
O 781-652-5758  |  484-553-1814

Get our comprehensive guide.

Learn about our proven, streamlined approach to taking your current analytics framework from where it is to where it needs to be, for less cost and in less time than you might imagine.

Download the eBook now

Check out the rest of the series.

If you rely solely on a data warehouse as your repository,  you have to put all your data in the warehouse–regardless of how valuable it is. Updating a data warehouse is more costly. It also takes a lot of time and effort, which usually leads to long delays between requests being made and fulfilled. Analytics users may turn to other, less efficient means to get their work done.

If you rely solely on a data lake, you have the opposite problem: all the data is there, but it can be very hard to find and transform it into a format useful for analytics. The data lake drastically reduces the cost to ingest data, but does not address issues such as data quality, alignment with related data, and transformation into more valuable formats. High value data may reside here but not get used.

When you have a system of repositories with different levels of structure and analysis, and a value-based approach for assigning data to those repositories, you can invest more refinement and analytics resources in higher-value data.

Striking the right balance between refinement and analytics is key. Performing analytics on unrefined data is a more costly, time-consuming process. When you can identify value upfront, you can invest in refining your high-value data, making analytics a faster, more cost-efficient process. 

Our value-based approach can help deliver higher ROI from all your data.

A picture containing diagram

Description automatically generated

This value-based approach also helps your modern analytics framework better meet the needs of your knowledge workers. For example, analysts can jump into complex analysis, rightly assuming that high-value data is always up to date. In addition, automated value delivery automatically distributes high-value data in ways users can act on. 

Let’s invest in a conversation.

We want to hear about your current framework and your changing needs. 

Schedule a time with Geoff Speare, our practice director:

Geoff’s Calendar
GSpeare@IronsideGroup.com
O 781-652-5758  |  484-553-1814

Get our comprehensive guide.

Learn about our proven, streamlined approach to taking your current analytics framework from where it is to where it needs to be, for less cost and in less time than you might imagine.

Download the eBook now

Check out the rest of the series.

Today’s companies have no shortage of data. In fact, they have more than ever before. And they know that, hiding in that data, are insights for better business decisions and competitive superiority. 

But even with all the investments they’ve already made, in everything from data marts and warehouses to operational data stores, companies suspect the most valuable insights may remain hidden. And they’re often right. If your current analytics framework is no longer meeting your needs, the signs are all around you.

Top indicators that it’s time to evolve your current framework

  1. Frustrated users can’t find the data or insights they need to drive better decision making. 
  2. Users rely on self-created spreadsheets not accessible to others. 
  3. Analysts spend more time on manual updates than on actionable insights. 
  4. IT-owned analytic assets take too long to update, reducing their usefulness. 
  5. High cost to manage data curtails innovation. 
  6. Your framework is already overwhelmed by the data sources you have, leaving no room for new ones. 
  7. Value leakage — in the form of data you aren’t acting on — grows every day.

So, what’s stopping you?

In working with companies across virtually all major industries, we’ve encountered just about every obstacle that keeps companies trapped in a data analytics environment that no longer meets their needs. Here are the most common concerns we hear, and how Ironside helps to address them.

“We can’t walk away from the investment we’ve already made in our current framework.”

We get that. It’s why a core part of our approach involves meeting you where you are, and helping you move forward from there – not from the starting line. You keep what you have and invest in ways that will give you the greatest ROI based on your needs.

“We don’t have the budget for a big increase in analytics spending.”

We find that a lot of companies actually spend more than they need to by treating all their data equally. It all goes to the data warehouse, where processing costs are high. With our value-based approach, you could end up reducing your spend. 

“We don’t have the time or resources to take this on right now.”

We can function as an add-on to your existing team, so that they won’t be overwhelmed by even more to do. Plus, the new architecture could drastically reduce manual tasks that are taking up their time—freeing them up to focus more on generating game-changing insights.

Three framework components will help you reach new levels of data analytics.

Diagram

Description automatically generated

Let’s make time for a conversation.

We want to hear about your current framework and your changing needs. 

Schedule a time with Geoff Speare, our practice director:

Geoff’s Calendar
GSpeare@IronsideGroup.com
O 781-652-5758  |  M 484-553-1814

Get our comprehensive guide.

Learn about our proven, streamlined approach to taking your current analytics framework from where it is to where it needs to be, for less cost and in less time than you might imagine.

Download the eBook now

Check out the rest of the series.

For users of IBM Cognos Analytics a popular request is to highlight alternating rows in a report. This article will demonstrate how to achieve this result using the list container and the property Conditional Styles.

In order to create the report, the following objects will be used:

Object Definition
List containerContains report data
Query CalculationsCreate calculations
Running-count() functionGet sequential numbers
Mod() functionGet remainders of 0 or 1
List columns body style ancestorAncestor object used to highlight the data
Conditional stylesCreate type of style

Finished Product

When the demo is finished your report will look similar to the following:

Let’s get started.  The first thing we’ll do is create a simple list report using the sample GO Sales (query) package included with the application.  However, you can use any data to follow along.  

Create the query calculation

  1. Select the blank template and create a report using the List container. 
  2. From the Sales(query) namespace add the Product number, Product and Revenue data items to the list.
  1. View the report in Page Preview.
  1. From the Toolbox, add a Query Calculation to the end of the list container next to Revenue.  The Data item expression dialog will open. Name the calculation Count
  2. Click the Functions tab at the bottom of the screen.   
  1. Open the Summaries folder and double click the running-count() function to add it to the expression.  This function returns the running count by row for a set of values.
  1. Click the second tab on the dialog box, Data Items , and drag the Product Number to the function.  Add the ending parenthesis.

Running-count(Product number)

  1. Click OK to view the results.

The result of the running-count() function will show sequential numbers on each row.

Create Values to Highlight

The mod() function returns the remainder of two numbers.  In our case it will generate the numbers 0 or 1 after the division takes place.  

We will nest the mod() function around the running-count() function to achieve this result.

  1. Double-click the Count column title to return to the Data item expression.
  2. Modify the expression as follows.

mod(running-count([Product number),2)

  1. Click OK when done to view the report.  Note the position of the parentheses and the divisor is 2.  Even numbers will have a remainder of 0 and odd 1.

Note:  the mod()function is available for selection, however, we are typing the expression to ensure the correct syntax is applied.

The results of the calculation show 0 and 1 on alternating rows. 

 Apply Conditional Formatting

We will now highlight the rows in the list object using the List Columns Body Style ancestor. A row with the value of 1 will be colored.

  1. Click any column in the List container and at the top of the Properties pane or on the flyout menu select the ancestor object and click List Columns Body Style.  When selected the area will highlight in the list.

2.  From the Properties pane double click the Conditional Styles property.  The Conditional Styles dialog box will appear.  Click the plus sign (+) and select New Conditional style > Count. Click OK.

  1. Click the plus sign (+) to add a threshold value of 0 and click OK.  In the Style column click the first edit button (pencil) and select a Background color. Click OK.  Note the arrow next to the 0 is pointing upward indicating the color will generate for values greater than 0. Click OK to exit all dialog boxes.
  1. View the report.

5.  Since the Count column is not needed in the report remove it using the Cut button (scissors). Do not delete the column as it is used in the calculation used to render the conditional formatting and must remain in the underlying query.

As you can see, alternating row colors in a list report is simple in IBM Cognos Analytics!

Happy reporting! 

For the original version of this blog post using IBM Cognos Workspace Advanced, click here.

As we enter into the Independence Holiday weekend, I wanted to drop a quick note. It’s hard to believe three months have passed since my last letter. The world is evolving daily and technology continues to play a critical role in how we all connect, track information and communicate worldwide. Despite the shift toward working remotely, the executive team and I continue to be impressed with the level of productivity, cohesiveness, employee engagement and strength as an organization that we have seen demonstrated by our team. 

Here are a few highlights:

Teamwork. My team has pointed out how their interaction with each other has expanded — collaboratively tackling projects, sharing knowledge to prepare for webinars, and helping clients deal with COVID-19’s impact on their data and business analytics. We’ve hosted weekly Town Hall forums and internal Step competitions that have promoted teamwork company-wide.Under our Strategies for Success free content offerings to our clients, we’ve rallied around our Take30 Series. 

These sessions hosted by Ironside’s Data Science, Data Advisor and Business Intelligence Leads, have made it important for Senior Consultants, Partners and Clients to come together to offer the best of our thinking. The planning and delivery has been mutually beneficial for our team and the ever-growing number of participants who we have shared 30 minutes together, multiple times per week since the start of the pandemic.

Education. This unprecedented time when we are not traveling to clients has offered a time for our consultants to learn additional skill sets and to expand their certifications. One of the greatest values we offer to our clients is understanding best practices related to integration aspects between our key partners: IBM, AWS, Precisely, Microsoft, Trifacta, Tableau, DataRobot, Snowflake, Alteryx, Matillion and Alation. For us, to continue to excel with these partners — cross-training between our Business Intelligence, Information Management and Data Science practices on our most utilized tools — has created many “a-ha” moments toward streamlining our delivery services.

Client Engagements. Despite the sunsetting of “business as usual” for now, Ironside’s business is strong. COVID-19 has impacted businesses in various ways, whether they are operating and accessing data differently or needing to measure the impact of the global environment on their businesses’ analytics. Perhaps now, more than ever, the demand for information and analytics is a “must-have” versus a “nice-to-have.” Some of our clients have found themselves busier than ever and racing to keep up with the demand for new analytics and reports. Other clients are compelled to be more hands-on with analytics that used to be automated by machine learning models that have been rendered invalid. In these cases and beyond, Ironside’s Analytics Assurance Service is here to help. Our team’s expertise is being leveraged for immediate, short term assistance to support organizations running as efficiently as possible, allowing clients to use their own skills for other tasks to avoid stifling tradeoffs. 

Thank you for your continued relationship with our team. From myself and my team to you and yours, we wish you a wonderful Independence Day. Stay safe and remain strong, both in business and in health.

Best,
Tim

The world has changed dramatically over the course of a single month, and companies are struggling even more with things that have historically challenged them:

  • Finding the best people to run, build and innovate on their analytics tools and data
  • Making these environments accessible to employees in a work-at-home model

In this Forbes article, Louis Columbus cites a recent Dresner survey that shows up to 89% of companies are seeing a hit to their BI and Analytics budgets due to COVID-19. The survey includes these two recommendations:

Recommendation #1

Invest in business intelligence (BI) and analytics as a means of understanding and executing with the change landscape.

Recommendation #2

Consider moving BI and analytical applications to third-party cloud infrastructure to accommodate employees working from home.


89% of companies are seeing a hit to their BI and Analytics budgets due to COVID-19.


We’re here to help you explore your options.

Now that the role of analytics is more important than ever to a company’s success, analytics leaders are again being asked to do much more with much less — all while companies are experiencing staff reductions, navigating the complexities of moving to a work-from-home model, and struggling to onboard permanent hires.

To address these short-term shortages (and potentially longer-term budget impacts), companies are naturally evaluating whether leveraging a managed-service approach — wholly or even just in part— can help them fill their skills gap while also reducing their overall spend.

As they weigh this decision, cost, technical expertise, market uncertainty and the effectiveness of going to a remote-work model are all top-of-mind. Here’s how these factors might affect your plans going forward:

Factor 1: Cost

As the Dresner number showed, most analytics teams need to reduce spend. Doing this mid-year is never easy, and usually comes at the expense of delayed or canceled projects, delayed or cancelled hiring, and possibly even staff reductions. All of these decrease a company’s analytics capabilities, which in turn decreases its ability to make the right business decisions at a critical time. A managed services approach to meeting critical analytics needs, even just to address a short-term skills gap, can provide valuable resources in a highly flexible way, while saving companies significant money over hiring staff and traditional consulting models.

Factor 2: Technical Expertise

A decade ago, your options for analytics tools and platforms were limited to a handful of popular technologies. Today even small departments use many different tools. We have seen organizations utilizing AWS, Azure, and private datacenters. Oracle, SQL Server, Redshift all at the same company? Yes, we have seen that as well. Some of our customers maintain more than five BI tools. At some point you have to ask: Can we hire and support the expertise necessary to run all these tools effectively? Can we find and hire a jack-of-all trades?

In a managed services model, companies can leverage true experts across a wide range of technology while varying the extent to which they use those resources at any particular time. As a result, companies get the benefit of a pool of resources in a way that a traditional hiring approach simply cannot practically provide.

Factor 3: Effectiveness of Remote Work Engagement

If you weren’t working remotely before, you probably are now. Companies are working to rapidly improve their processes and technologies to adjust to a new normal while maintaining productivity.

Managed service resourcing models have been delivering value remotely for years, using tools and processes that ensure productivity. Current events have not affected these models, therefore making them an ideal solution for companies  trying to figure out the best way to work at home.

Times are changing. We’re ready!

Ironside has traditionally offered Managed Services, to care for and maintain customer platforms and applications, and consulting services, to assist in BI and Analytics development.

Companies can leverage our Analytics Assurance Services temporarily, for a longer period of time to address specific skills gaps, or to establish a cloud environment to support remote analytic processes.

With Ironside, you can improve your data analytics within your new constraints, while reducing your costs. We’d love to show you how.

Contact us today at: Here2Help@IronsideGroup.com

Any journey requires a few things before getting started. Wandering through the forest can be a very pleasant experience, but if you don’t plan ahead and bring your compass and map, what happens if you get lost? (I know, you probably brought your smart phone, which has GPS. But then you find there is no signal, way out here in the forest…). Before starting an adventure like this, you need to prepare and make sure you are ready for any obstacles or unknowns that could occur.

Read more