Tag Archive for: IBM Cognos

Set Dynamic Default Prompts Using the New JavaScript Prompt API in IBM Cognos 10.2

Continuing with our Report Studio Cookbook series, today we will look at the new Report Studio JavaScript prompt API available in IBM Cognos 10.2. Since the very first release of the web based Report Studio, report authors have been asked often to use JavaScript in a report to achieve some common web application functionality, such as dynamically show/hide certain objects on page based on a user’s selection or changing a page’s color theme by data values. Ironside has published several articles illustrating how to use JavaScript in Report Studio; however undocumented JavaScript APIs and difficulties in migrating JavaScript after a Cognos upgrade have prevented many report developers from exploring this area. Read more

The Ironside Group is pleased to announce some exciting additions to our training practice. After opening our Atlanta office in January 2012, and our continued growth in the Southeast, we are now offering IBM Cognos training in Florida. We have classes scheduled in Tampa, Miami and Boca Raton with more to come. Check out our training schedule for details. Read more

This article is based upon an interview with Monique Dozier,  Assistant Vice President of Advancement at MSU.

In 1989, Howard Dresner, a leading analyst for Gartner, coined the term “business intelligence.” In 1994, this thought leader, strategy advisor, and former Gartner Research Fellow, made the following powerful prediction: Read more

This is the second in a series of articles for the Ironside Cognos Report Studio Cookbook. The first article can be viewed here. These are tips and tricks used by our professional report developers to meet the unique needs and requirements of our clients. While some of these techniques may be touched upon in a typical Report Studio training class, we will take a deep dive into these concepts to uncover how our professionals actually use them in the field every day. Read more

IBM Finance Forum

Finance Forum is a global series of complimentary events designed specifically for you—the finance professional.  IBM Finance Forum showcasing the latest IBM solutions for performance management, financial governance, risk management and incentive compensation IBM Performance Eventsmanagement. Read more

Introduction

When faced with the challenge of creating and securing custom views in Transformer models (and their resultant PowerPlay cubes), one can easily perform the necessary steps via the Transformer GUI. However, when the number of custom views to be created and secured is large, it often makes sense to perform this task by using Model Definition Language (MDL) scripting – to both accelerate the time to deployment and reduce the errors that can occur with such a manual process. Read more

Portfolio Analysis
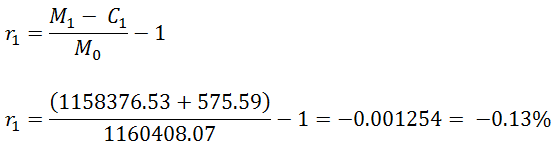
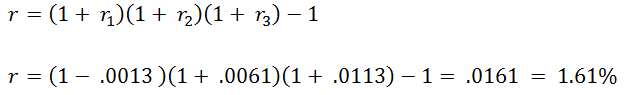
In the investment management or financial services accounting world, one of the most common calculations you encounter in is the time-weighted rate of return (TWROR). The time-weighted rate of return (sometimes called the geometric mean return) is a method of measuring historical performance of an asset or portfolio when external cash flows are present in the equation.

For example, if in your very own 401k, you make a transfer of funds from your money market account to purchase shares of a mutual fund, you would not want to count that influx of capital towards the overall rate of return on that fund (or your entire portfolio) as it would be inaccurately skewing the results in a positive manner. Conversely if you sold off a holding, or made a withdrawal, that could artificially skew portfolio performance in a negative direction. For more information on the definition and derivation of the time-weighted rate of return, please refer to this Wikipedia entry.

Understanding the TWROR Formula

For the purpose of this exercise, we will be using the following formula for calculating TWROR:

Where:

  •  is the time-weighted return for the portfolio
  •  is the initial portfolio value
  •  is the portfolio value at the end of sub-period 
  •  is the net inflow which occurs in sub-period 
  •  is the number of sub-periods

What you will notice here is that this formula is a geometric series, otherwise known as a product or compounded calculation. Essentially we will calculate each sub-period’s rate of return (in this case a month) and then take the product of all of those sub period returns to yield the overall true time-weighted Rate of Return for the series of sub periods (in our example a year).

Example: Manually Calculating a Quarterly Portfolio TWROR

Period Beginning MV Ending MV Net Flow Period RoR
201101 $1,160,408.07 $1,158,376.53 ($575.79) (0.13%)
201102 $1,164,886.97 $1,172,048.35 $0.00 0.61%
201103 $1,170,999.41 $1,184,244.77 $0.00 1.13%

Given the above data set, we would like to manually calculate a quarterly TWROR to demonstrate how the formula is applied.

  1. First we calculate our sub-period rate of return using the following formula:
    manual-twror-step1
  2. Then we chain all of our sub-period rates of return together to come up with the final time-weighted result for the quarter:manual-twror-step2

If we were to calculate this number in Excel, we would simply use the PRODUCT function to multiply all of the rows of values in a given column together to give us the final TWROR. Because there is no equivalent aggregate function in Report Studio (or SQL for that matter) we need to use a little mathematical trickery to come to the same solution. This is actually were most report developers throw their hands up and ask their users to finish their analysis in Excel. We are going to show you how to do 100% of the work in report studio.

Calculating the TWROR in IBM Cognos Report Studio

We will be using IBM Cognos 10.2 Report Studio for this example, but this approach will work for any version of IBM Cognos.

  1. Start by creating a simple list report in report studio that has the following fields from your investment data mart:

    1. Sub Period (Year Month Number)
    2. Period Beginning Market Value
    3. Period Ending Market Value
    4. Net Capital Flow (Deposits – Withdrawals)
  2. Filter your list report by a single year, and/or portfolio
  3. Create a data item called Periodic Rate of Return with the following calculation:((-)/)-1
  4. Test your report and confirm that your periodic ROR calculation is accurately representing returns, net of any capital movement.
  5. Select the Query Explorer in Report Studio and drag a new query from the toolbox and rename it to Portfolio Total.
  6. Select the query from your list report (which we renamed to Periodic Holdings) and drag it to the right of your Portfolio Total query until a black bar appears, at which point release the mouse. Your new Portfolio Total query now references the Periodic Holdings query. We do this to force report studio to keep our sub-period ROR calculations at the correct level of detail.
  7. Double click your Portfolio Total query and drag a new data item from the toolbox into the data items list. Enter the following calculation and give the data item the name TWROR:exp(total(ln(1+.)))-1
  8. This is the mathematical trickery we were referring to before. The geometric series or product function can be replicated by taking the exponent of the sum of the natural logarithm of those values. This technique can be used for any geometric calculation you need to reproduce in SQL or Report Studio.
  9. Switch back to the page explorer, and drop a new list or singleton in your report that references the Portfolio Total query, and make sure the new TWROR item is present.
  10. Export the contents of your report to Excel and validate your numbers using the PRODUCT function.

We used two queries in this example to achieve the result. We could have done it all with a single more complex query, but that can sometimes require local report processing depending on the type of database you are using. A report specification for IBM Cognos 10.2 Report Studio is attached for your reference. Hopefully this technique allows you to simplify the lives of your portfolio analysts by arriving at answers faster without having to use multiple tools.

Next Steps

If you’re embarking on an initiative to provide better business analytics for your organization in the areas of investment management, institutional or private equity asset management, and hedge funds or other related financial services sectors, we encourage you to contact us for more information. Our financial services business analytics experts are familiar the unique challenges of the industry and deeply attuned to the needs of your analyst community. Our unique combination of industry experience and IBM Cognos domain expertise enables us to rapidly arrive at high impact solutions that are tailor made for your financial services organization.

A request we often get is to build more dynamic dashboards and reports. This can be accomplished by a combination of Report Studio prompt reports, portlets, drill-up/drill-down and filtering. The key to this interactivity is communication between IBM Cognos portlets and channels. Utilizing channels allows us to create dynamic filtering and drilling capability. This article will explain the basics of using portlets and channels and provide a sample of how to create a dynamic dashboard. Read more

SPSS allows users in almost any industry to see into the future. The solution is part of IBM’s Business Analytics portfolio and works seamlessly with Cognos, the world’s flagship business intelligence reporting tool. Utilizing predictive analytics, SPSS connects data to effective action. SPSS draws on a powerful reserve of algorithms to analyze an organization’s existing data, as well as newly-captured data to enable smarter decisions and improve outcomes. When integrated with Cognos, different levels of users — from executives to analysts — can see game changing reports, scorecards, and other visuals on their desktops or mobile applications (as illustrated below). Read more

IBM Cognos 10.2 Enterprise was announced today, and with it comes increased usability, performance and a host of new features. Below we’ll take a walk through a few of these new features and highlight how they’ll impact your bottom line business.

Cognos Insight 10.2

Cognos Insight, released in Early 2012, is the Personal Analytics solution that has taken the marketplace and user’s desktops by storm, garnering a #1 ranking among all Self Service Business Intelligence Platforms in The Forrester Wave (Q2 2012). Cognos 10.2 continues to improve ease of use, and integration with IBM Cognos Enterprise to encourage collaboration and enterprise distribution while avoiding data silos that other competitive solutions can create. What’s the use of personal insight if the entire organization cannot stand to benefit?

IBM Cognos Insight 10.2 Tree Map

Tree Maps
Customers and Partners alike have clamored for improved data visualizations and IBM has responded in kind. The addition of Tree Maps to Cognos Insight pays homage to the applied data visualization theories of luminaries such as Edward Tufte and Stephen Few and it is a theme that is quite prevalent in Cognos 10.2. Unfortunately, we’ll have to wait for Tree Maps in the enterprise studios as this is a Cognos Insight-Only feature for now.

Smart Metadata
A new data discovery engine in Cognos Insight will automatically detect dimensional levels in hierarchies and even differentiate between numeric attributes and measures. This means users will spend even less time importing data, further shortening the learning curve of this already intuitive platform.

Drill-able, Drag and Drop Charting and Top/Bottom Filtering
Users can now drill up and down directly on charts, just as is possible in Cognos Enterprise, and they can also drag and drop dimensions and measures directly onto charts as opposed to having to retain a crosstab in prior versions. Also included is rapid top/bottom filtering in Crosstabs that is always a simple right click away.

Package Import
Prior to this latest, release users could import data into Cognos Insight from existing IBM Cognos Reports. IBM takes the story of unified metadata one step further allowing users to source data directly from the same ad-hoc reporting packages that are published in the Cognos Enterprise environment. For IT and business alike this means master data management and data governance from the enterprise to the desktop: unified business logic and terminology at every step of the way.

Time Rollups
Cognos Insight now has out-of-box functionality to build custom time dimensions or roll-ups. Populate entire years regardless of how sparse your data may be or customize it to match your organizations fiscal calendar.

High Fidelity Publish
Customers who also have IBM Cognos TM1 Enterprise can publish their Cognos Insight dashboards to Cognos 10.2 Enterprise as full-fledged, tabbed Cognos Workspaces. This means that Cognos Insight users can share their analyses with other Cognos Enterprise users who do not have Cognos Insight capabilities. This is huge from both a customer licensing and a usability perspective as prior releases required that any users who wanted to view an Insight dashboard must have Cognos Insight capabilities, which came at the higher Advanced Business Author licensing level. To view a Cognos Workspace a user need only be at popular Enhanced Consumer license tier. What’s a Cognos Workspace you ask? Read on…

Cognos Workspace (Formerly Business Insight)

It seems a little strange to say we’re glad that IBM Cognos 10.2 delivers fewer “insights”, but the renaming of Business Insight and Business Insight Advanced to Cognos Workspace and Cognos Workspace Advanced respectively, is a welcome change. Hopefully this will help to ease some of the confusion that’s arisen in recent years among a myriad of “insight” labeled components in within the IBM Business Analytics solution portfolio. Along with this re-branding, come a number of useful new features.

IBM Cognos Workspace

Multi Tabbed Workspaces
A major enhancement to Cognos Workspace is the ability to easily create multi-tab workspaces enabling you to expand your workspace’s visual footprint without the need to scroll. With tabbed workspaces also comes a new control known as an Action Button which can be programed to trigger tab changes.

Freeze and Unfreeze Column and Row Headers
Excel users rejoice, they’ve added the functionality to freeze and unfreeze crosstab column and row headers while scrolling.

Data Visualization Guide
As mentioned previously, the theme of applied data visualization theory is a recurring one in Cognos 10.2. The new Visual Recommender in Cognos Workspace will help you to select the appropriate chart type based on the data values in your workspace, along with some insightful rationale for that decision.

Graduated Capabilities
Administrators can now assign graduated capabilities to the Cognos Workspace tool. Users can have the option of Authoring, Interacting or just Consuming any Cognos Workspace. This is useful in controlling the available Cognos Workspace feature set for governance purposes, or to even further simplify the experience to drive adoption in a user population of diverse skill sets.

Other Features
Cognos workspace 10.2 also brings support for printing and use in Google Chrome and Safari.

Cognos Mobile

Cognos Mobile was a major focus in the 10.1 (General) and 10.1.1 (Refresh Pack) releases, with outstanding functionality and support across a broad set of devices. In 10.2 Mobile sees a few minor, but noteworthy updates.

Push Notifications
Cognos Mobile now supports push notifications to the status IOS status bar in the iPad app – users can now be notified when a new version of their report is available, further reducing the latency in decision making on the go.

Improved Performance of Multi-page Reports
Multi-page reports can now be streamed to devices, reducing the loading time. Users no longer have to wait for the entire report to download before viewing.

Administrators Can Now Secure Mobile Access
A new mobile capability in Cognos Administration allows administrators to govern access to Cognos via Mobile devices. This has benefits from a governance perspective for all organizations that deploy Cognos Mobile, especially those that employ a Bring Your Own Device (BYOD) policy.

Report Studio

Report Studio, the work-horse of the IBM Cognos solutions suite, receives a few minor, but high impact updates in the IBM Cognos 10.2 Enterprise release.

Cognos 10.2 Prompt API

Prompt API
The new prompt API is a long overdue and welcome update to Professional Authors and Report Studio hackers everywhere. The API is 100% documented and supported, and like any good API can be expected to persist across future product renditions. The API provides a documented method for setting, reading, deleting and validating prompt values using JavaScript. The API is supported in Report Studio, Cognos Viewer, Cognos Workspace and Cognos Workspace Advanced.

Excel Improvements
Expect improved Excel compatibility of Cognos report outputs with increased spreadsheet maximums to 16,384 columns by 1,048,576 rows. Cognos 10.2 also brings a brand new Excel output format called Excel 2007 Data which is perfect for lightweight data transfer to Excel without any report formatting.

Dynamic Cubes

By far the most exciting new feature in Cognos 10.2 is the addition of a new OLAP technology to the IBM Cognos solution suite which in conjunction with pre-existing OLAP options provides developers with the option of the right tool for the job at hand. The Dynamic Cube solution builds upon existing Dynamic Query Mode (DQM) functionality to close a major gap that exists in many vendor OLAP offerings: the organization with a large or mature star or snowflake schema data warehouse that wants to provide an OLAP experience to their users without sacrificing data details or high performance.

IBM Cognos 10.2 Dynamic Cube Architecture

Here are a few highlights of this new feature:

  • 100% In-Memory OLAP Engine for a high-performance, low-latency user experience.
  • Minimized access to the underlying data warehouse.
  • Security aware caching features.
  • Aggregate awareness to allow query routing to in-memory or physical aggregate tables in the data warehouse.
  • Aggregate Advisor feature will monitor, recommend new physical aggregate tables, and even generate SQL/DDL.
  • Uses a new OLAP modeling tool called Cube Designer that should be intuitive to developers with previous OLAP experience.
  • Multiple cubes can share conformed dimensions.
  • Use of Multi-Pass SQL is easy on data warehouse server resources and DBA’s alike.
  • 80 times faster than similarly modeled dimensionally modeled relational (DMR) data sources.

Transformer and PowerCube loyalists (ourselves included) can breathe easy as this new technology is not a signal of their decline. Dynamic cubes are meant to complement existing OLAP technology and provide developers with the most appropriate option for every scenario, rather than trying to force a one-size-fits-all solution. Expect a more in-depth exploration into the Dynamic Cube technology in a future newsletter, as well as the announcement of a new training offering from the Ironside Group.

Architecture and Environment Support

New Data Sources
With every release we see exciting additions to the list of supported environments, and Cognos Enterprise 10.2 is no disappointment. You can expect full support for a number of new data sources, a few of which are listed below:

  • Big Data Support: Hadoop / Hive via JDBC Connector
  • SQL Server and Analysis Services 2012
  • Salesforce.com (Native DQM)
  • SAP ECC (R3) (Native DQM)
  • Siebel (Native DQM)

The big news here is native support for Big Data and seamless integration with IBM InfoSphere BigInsights (Hadoop). Additionally, native support for a number of ERP vendors has been added to Cognos via Dynamic Query Mode for increased performance and reduced implementation complexity. Prior to 10.2, support for data sources such as Saleforce.com, SAP ECC and Siebel required a connector via Virtual View Manager (VVM).  We should also note that VVM 10.2 will be the final release of this solution, and while it will continue to be supported, developers should take note that it is now deprecated in favor of DQM.

100% 64 Bit
These remaining 32 bit components of IBM Cognos 10 get an update for full 64 bit compatibility: BI Gateway, Metric Studio and Data Manager

Multi-Tenant Support
Cognos 10.2 now supports native multi-tenancy. While this feature may not have mass appeal, it will be incredibly valuable to certain IBM Cognos OEM partners as well as organizations that have deployed Cognos in a federated manner and are looking to more easily segment different business units or sub-organizations within their shared IBM Cognos platform architecture.

Content Archiving
Last but not least, Cognos 10.2 now natively supports fully integrated content archiving to a file system. This feature will be coveted by organizations that have content retention and audit requirements that are looking to keep their Cognos content store free from large report outputs to maximize their environmental performance. This new feature has much of the same archival functionality that IBM FileNet customers have enjoyed since the 10.1.1 release.

Whats Next?

Want to learn more about Cognos 10.2? The Ironside Group is now offering a 1-day online course that covers everything new in Cognos 10.2. You can view the course curriculum here, and register here. Do you have questions about upgrading to version 10.2, or would like to better understand where these new features and technologies complement and enhance your organizations overall Business Intelligence strategy? Are you considering Dynamic Cubes and would like to know more about design and development best practices, or environment sizing recommendations? Contact Us for more information or to speak with one of our veteran consultants today.