Power BI/SSAS Tabular Modeling Essentials

Gathering data is an essential step before performing analysis in Power BI Desktop. The tool allows users to connect with many different data sources, such as traditional or cloud databases, text files, big data, and live streams. Among these sources are SQL Server Analysis Services (SSAS) Tabular models, which are widely leveraged for enterprise solutions. Why? Let’s dive into Tabular Modeling to learn more.
The Design
Similar to many other BI metadata modeling tools, a good tabular model starts with good design. Proper design will enable users to answer key business questions using a transformed business view of the data.
There are three important concepts to keep in mind when crafting a tabular model:
1. Performance: Only import tables and columns which are truly needed for analysis. The less, the better (for performance and cloud storage reasons). Especially for in-memory mode, as actual data will be populated and cached when leveraging Azure and deploying SSAS to the cloud. Power Query M functions are very handy for this step, such as Table.SelectRows, Table.SelectColumns, Table.RemoveColumns, etc.
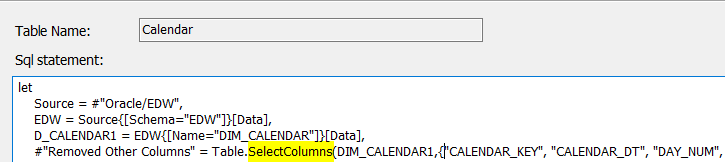
Another best practice is to optimize source table structures in the database tier to the greatest extent possible. You may build a tabular model off of a transactional database, however a de-normalized data mart or enterprise data warehouse (EDW) will work much better. If that is not an option, at a minimum, create database views to help with complex calculations and multiple fields joined between tables.
2. KPIs: Key Performance Indicators are frequently requested by business users. KPIs provide a quick “scorecard” to summarize business success or to identify top trends. Power BI has built-in visualizations for KPIs which make them easy and convenient to use. To leverage this feature, make sure you create measures that have the following properties:
- Value: the base measure you want to evaluate
- Target: the goal to compare the Value with
- Trend: 12-24 month time period of Value performance
- 13 and 18-month trends are the most popular
- 24+ month trends can be a challenge to visually present in a single chart
3. Presentation/Navigation: Business users rely on the published metadata to do their business analysis. It is critical that the model is presented in a business-oriented view to allow users to quickly understand what relevant information is available. For instance, customers are associated with orders – all customer information and activities are labeled and grouped under the same navigation node. You can hide or remove non-business fields such as table keys.
Transformation
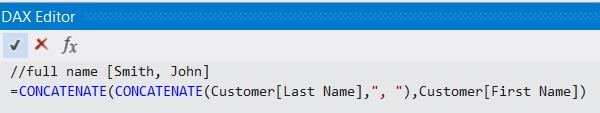
It is very common that you will need to add calculated measures and columns and apply DAX functions to further transform source data per your business logic. Measures can be added using standard aggregation functions like AVERAGE, COUNT, SUM, or even custom DAX formulas. Sometimes, measures are created in fact tables. That said, a measure can also be independent of the table it is associated with. On the other hand, calculated columns are always directly associated with tables.
The fundamental difference between a calculated column and a measure is a calculated column evaluates values for each row in the column. For this reason, from a performance standpoint, avoid calculated columns if they can be created as calculated measures instead. Many DAX functions are available for use to create measures, calculated columns, or calculated tables. For best coding practices, keep all functions as legible as possible. Add comments and notes, use variables (delete unused ones), use user-friendly descriptive names, and be explicit with all references.
Security
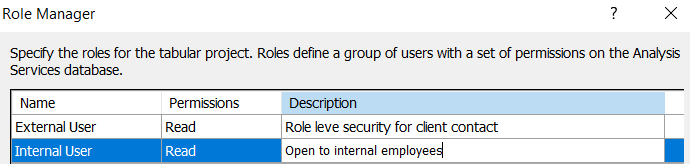
Enterprise tabular models are typically designed to be consumed by a variety of users. As such, security design and implementation are critical for success. Tabular models support both object and row level security. Modelers define roles through Role Manager in SSDT (SQL-Server Data Tools), and after a model is deployed, model database administrators can manage role members by using SSMS (SQL-Server Management Studio). For SSAS (SQL-Server Analysis Services), role members must be in AAD (Azure Active Directory) and usernames and groups must be specified by organizational email address or UPN.
Dynamic row level security is achieved based on the username of who is currently logged on (USERNAME Function) or the CustomData property (CUSTOMDATA function) within a session.
There are a few rules to keep in mind:
- Table-level security cannot be set for a model if it breaks a relationship chain. For example, if table A joins to B, and B joins to C, you cannot secure table B. The reason? If security is applied to table B, a query on table A cannot transit the relationships from table A to B, and from table B to C. A better approach would be a configured relationship between tables A and C.
- Row-level security and object-level security cannot be combined from different roles. For instance, Role A is set to see region A’s data only against table A (sales data), Role B is set to view table B (budget data), which may contain all regions data and does not have row level security. A user who belongs to both Role A and Role B will get errors at run time.
- Grant vs. Deny – avoid overlap settings (similar to folder permission settings). Deny takes precedence over “allow” permissions. If a user is granted to see table A from one view, but is denied to get any data from table A from another view, then this user will not be able to see table A. If a role is not granted access to the entire table, it is better to configure access at the object level rather than using a row level security via DAX.
- Security is automatically applied to dynamic calculations (measures, KPIs) if they reference a secured table or column.
- A hidden table doesn’t deny data access. If a user is leveraging Power BI Desktop, they may still be able to see the hidden table.
- Always test a secured model before going live, via Analyze in Excel or PBI online, preferably simulating with multiple users with different security configurations.
Relationships
When you import from relational databases, the Import Wizard detects existing relationships based on the source schema data. If related tables are imported altogether, those joins will be automatically created in the model. However, in many instances you must manually create relationships between tables per reporting needs, as often the wizard will not join these tables properly.
It is very important to create joins to meet reporting requirements, not to model the tables per the original source database structure. One-to-one and one-to-many relationships are the most common joins you will likely define in the model.
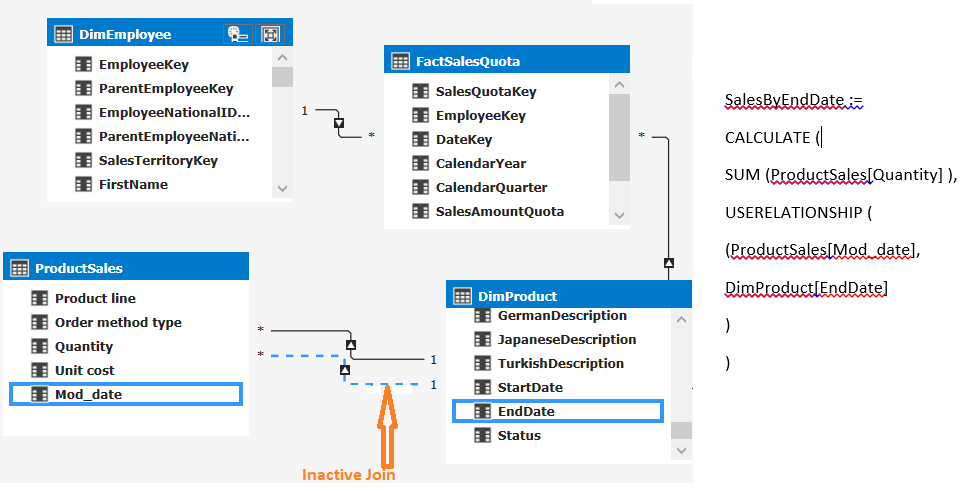
To avoid ambiguous dependencies between tables, a tabular model only allows one active relationship between each pair of tables. Active joins are displayed in solid line and automatically applied when fields are used in report from joined tables, while native joins are shown in dash-line in the model and are not applied by default. Inactive joins can be triggered in report query via DAX formulas to calculate measures dynamically. For example, to get a summary of sales volume by Product End Date, which is an inactive join, you can use function USERELATIONSHIP to activate the desired join.
In modeling scenarios where multiple joins between tables are required, you will need to import the same table multiple times and then create one relationship between each pair of copied tables, as there is no alias feature in SSDT. Many-to-many relationships or full other joins are not officially supported, however, you may use DAX functions to achieve them.
From a performance perspective, it is not recommended to create such extensive joins. Self-joins/recursive joins are also not supported. Recursive joins are typically used to define parent-child hierarchies. Should you encounter a need to model recursive joins, it is best to resolve this at the database layer.
Presentation/Organization
An SSAS tabular model can represent a complete EDW with many tables, measures, and dimensions. Such complexity could be very daunting for users to explore. Often, users may only need to act on a small part of the model to fulfill their business intelligence and reporting requirements.
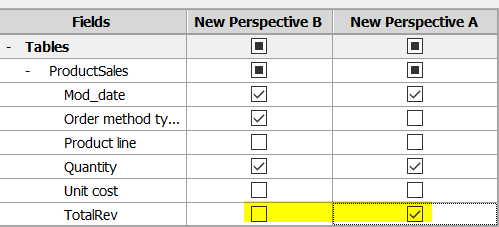
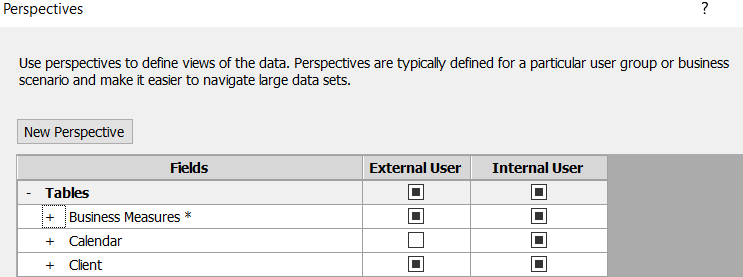
To provide users with an intuitive, highly usable experience, we can leverage a feature called “Perspectives.” These are typically created and assigned per user role or business unit so that only the pertinent viewable objects are exposed to this group of users. For example, if a model contains product, sales, financial, and employee data, a sales rep will want to see product and sales data, but may not require employee or financial data. Similarly, an HR analyst is unlikely to require data about sales. The use of Perspectives can control who sees what tables and fields and the appropriateness to the user audience.
One thing to note: Perspectives are not meant to take the place of role level data security, nor can Perspectives provide access to model objects that a user does not already have access to.
Deployment
An SSAS tabular model is typically published as an “Analysis Services database” that runs in-memory or in DirectQuery mode. In the latter situation, the model connects directly to back-end relational or other data sources. At run-time, when the client application (such as Power BI report) requests data, the SSAS Vertipaq analytics engine delivers fast data access using compression algorithms and a multi-threaded query processor.
You can deploy tabular models to the cloud through Azure Analysis Services or on-premises (local SQL Server Analysis Services in Tabular server mode). You can process and/or refresh data in tabular models easily via SQL Server Management Studio. A typical practice is to schedule a daily job at the end of your ETL process to refresh the data in the tabular model to ensure the data made available to the end user community is kept up to date.
If you enjoyed this article and want to read more written by Susan Ma, view her collection.
About Ironside
Ironside was founded in 1999 as an enterprise data and analytics solution provider and system integrator. Our clients hire us to acquire, enrich and measure their data so they can make smarter, better decisions about their business. No matter your industry or specific business challenges, Ironside has the experience, perspective and agility to help transform your analytic environment.

