Data Warehousing Basics

Cognos makes extensive use of data warehousing concepts. Most data warehouses are built using dimensional modeling techniques (also known as the “Kimball style”). Data is divided into fact and dimension tables, which are joined together in star schemas. Restructuring data in this fashion takes a great deal of effort, both in planning and implementation. These types of changes are only done because they are necessary for high-quality analytics. Understanding more about how they work and why they are important can help make Cognos a more efficient and effective reporting tool.
Data Warehousing Basics
Most people in Business Intelligence have heard of the terms facts and dimensions. These are vital in understanding how a dimensional model functions.
Facts
Fact tables contain measures. A measure is a numeric value that is aggregated in some way. Usually measures are summed, but they may also be averaged or combined using different formulas. The main point is that they are generally not important for their individual values but instead are combined together.
Dimensions
Dimension tables contain attributes. An attribute is a value that is used to group, filter, or describe data. Any string or date value is almost guaranteed to be an attribute. Numeric values can also be attributes (for example, model numbers or employee IDs) so long as they are intended to be displayed separately instead of combined.
As with everything in data modeling, there are exceptions. Sometimes a text value is used as a fact. Sometimes numeric values are stored in dimensions even when they are summed. Understanding the principles of why data is organized this way helps with knowing when these exceptions are appropriate.
Principles of Dimensional Modeling
Data is organized into a dimensional model to make reporting more efficient. Relational database systems have performance limits, especially with the high volumes that data warehousing is built to handle. The more data in a database, the slower it will be.
Within the systems that create the information that a relational database gathers (such as a point of sale system, a customer relationship system, etc.), the data is organized for the requirements of those systems. Usually this means a high volume of small transactions (lots of sales, lots of customer calls, etc.), each of which touches a small amount of data. In a data warehouse, those requirements change and are often the exact opposite. A warehouse will have a smaller volume of transactions, but those transactions will be very large, such as loading an entire day’s worth of data or analyzing a quarter’s worth of sales. Many organizations mistakenly call their source system (or a mirror of their source system) a “warehouse”. A different data structure is needed to handle these requirements. A dimensional model optimizes this high volume in three ways: narrow fact tables, short dimension tables, and a small number of joins.
Narrow but Tall
Fact tables are intended to be “narrow but tall”. Fact tables usually have a lot of rows, with each row representing a sale, a transaction, or some other event. Data will usually be added to fact tables at a rapid pace (thousands or millions of transactions a month). With so many rows in the table, each row should be as small as possible. Each reduction in row size is multiplied by the high number of rows to produce larger space savings. Since numbers do not take a lot of space to store, it makes sense to put only numbers in a fact table whether these values are actual measures or numeric ID values that point to dimension tables. This leads to relatively small fact tables, which means better performance.
When creating a fact table, the level of detail represented by the fact is important. A fact is defined by the dimensions it connects to – the measures in the table need to be relevant to each of those dimensions. For example, a fact table for sales might have dimensions for sale date, customer, and product. If some sales involve more than one product, they will need one row for each product, meaning that all measures (for example, sales amount, discount, and tax) need to be known for each separate product. If the source data does not have that level of detail, this design might not be feasible.
Wide but Short
Dimension tables are intended to be “wide but short”. A dimension usually represents some sort of business entity (customer, product, region, etc.) with a set of related attributes. They usually have many fewer rows than fact tables and tend to add rows at a much slower pace. Because the tables have fewer rows, it’s less of a problem to make those rows wide with lots of columns. Text in particular takes a lot of space, so putting text columns in dimension tables is especially important. The short, wide structure also means that it’s okay to duplicate data across rows (this is called “denormalization”). If you have a geography dimension, for example, it’s not an issue that the same country name is repeated for each state and zip code row.
When creating a dimension, it’s very important to understand the nature of what each row represents. Ideally, a dimension row should meet all of the following criteria:
- Represents a concrete business entity (something that business users can understand)
- Has a level of detail that is directly relevant to fact tables (a fact table should tie to exactly one row in each dimension)
- Applies to a large number of fact rows (there should not be a separate dimension row for each fact row)
Before creating a dimension, look at the source data and see how many rows the dimension will have as compared to the fact tables to which it connects. There should be far fewer dimension rows. If this is not the case, the dimension should probably be redesigned. Dimensions with too many rows will reduce performance.
Joins
The last part of optimizing through dimensional modeling is joins. Joins (the act of combining two tables based on a common column) are an expensive database operation. Traditional database designs feature lots of small tables. Joining all of these tables together for reporting purposes will result in poor performance. In a dimensional model, each fact table joins to a small number of dimensions. This means most queries will involve just a few joins, possibly only one or two.
With fact and dimension tables together, reporting becomes a simple affair. For a given measure, there are a set of defined dimensions which represent the known attributes about that measure. Users can drag in the attributes they want to group or filter by, and then add the measure they want to report on. This collection of a fact table and its dimensions is the source of the term “star schema”.
Note: Partly as a response to this performance issue, there are now information appliances, such as IBM Netezza, which are custom-built for high-performance without requiring dimensional modeling. The same principle of high performance applies – it’s just that the way of achieving it is different.
Using Dimensional Models
The “best” way to use Cognos is to write queries that use a single fact table and related dimension tables. These queries can leverage the full benefits of a dimensional design.
Some queries have a “multi-fact” design and combine measures from multiple fact tables. These queries need to include at least one dimension that is shared between these fact tables, or the data is unlikely to be useful. When these queries also include dimensions that are not shared, users need to be aware of how the different data items relate. Otherwise, there may be a misunderstanding of what the report provides or a data model design that fails to meet all business requirements.
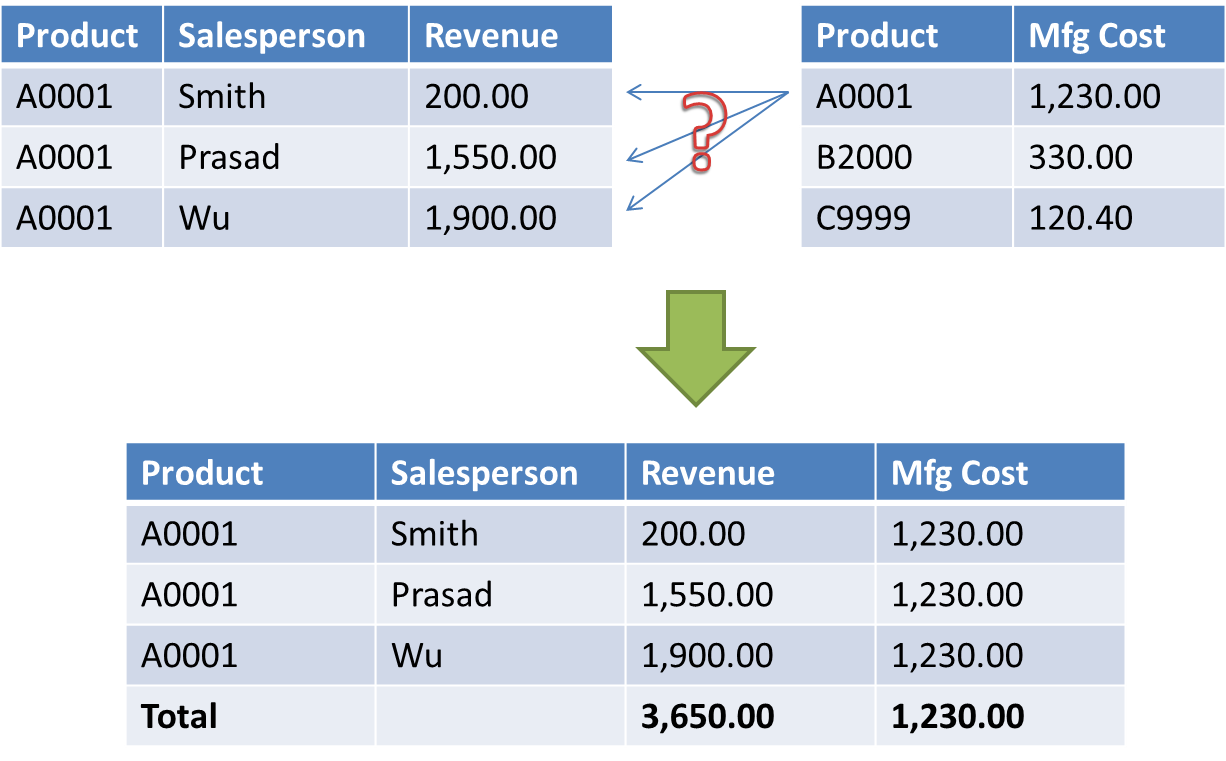
For example, imagine combining information from a sales fact table and a manufacturing fact table. Both share a Product dimension, but the sales fact table has an additional Salesperson. A report that combines sales revenue with manufacturing cost and groups by product will work fine because both fact tables have this dimension. If Salesperson is added to the report, however, there’s no way to divide the manufacturing cost data between different Salespeople. Cognos will instead put the total product cost beside each salesperson’s name, which might not be what the user is expecting.
In this case, the report author might be asking for this information without understanding that the cost cannot be tied to a salesperson. However, it might also be the case that such a link exists but is just not present in the warehouse. In that case, the data model might need to be modified to include that connection. (In the example above, the manufacturing cost might be tied to the number of units sold, or it might require looking back in time to see raw materials costs at the time each product was manufactured.)
Calculations off of dimension attributes are a common occurrence in Cognos reports. A field might be initially accurate, but over time the business process acquires additional details that are not completely reflected. Report writers may use CASE or IF statements to handle this logic (for example, “use the sales region field as is, but if the zip code is 12321 change it to Northeast, and if the sales rep is Jerry, change it to Southeast”). These changes mean that the database will have a harder time optimizing the query, and the reports using this logic may run slower as a result. Additionally, this logic has to be maintained in each report or Framework Manager model.
Updating the dimension table with these types of logic changes will both improve database performance and ensure that all users are using consistent logic. Depending on the nature of the change, it may make sense to create a new field or replace an existing one.
Lastly, manual joins within reports can have very large performance impacts. With dimensional modeling, the fact and dimension tables are joined using numeric identifiers (foreign/primary keys). These identifiers are usually indexed and allow for very fast joins. If data needs to be connected in some other manner, Cognos allows creating joins directly in the report. These joins are likely to be slower, particularly if they are on attributes (for example, joining on Sales Region) rather than numeric identifiers.
Update the Model
In nearly all of these cases, updating the warehouse model and reorganizing the data can result in dramatic performance improvements and simpler reporting.
In the case of multiple fact queries and manual joins, it is often the case that there is a single fact table that can be created to contain all of the measures involved. If a particular query is used frequently enough, it makes sense to create an aggregate fact table to serve those reporting needs. This usually involves combining measures from multiple fact tables and discarding dimensions that are not used by all the fact tables involved. It may also mean discovering that a dimension needs to be added to an existing fact table because a relationship exists that was not implemented previously.
For calculated dimension attributes, the dimension should be updated to contain commonly used calculations. These might be additional fields or replacements to existing fields. This update will allow the database to store and optimized access to these values and will make sure that everyone uses the same calculation logic.
The important thing is to monitor report creation to see when authors are starting to “stretch” the existing model, then assess what changes should be made to ensure that the model reflects current business needs.
Business intelligence provides answers, which always lead to more questions. Data warehousing will change over time. The dimensional structure of the warehouse needs to keep up with this change in order to best serve the business in a fast and efficient manner.