IBM SPSS Statistics and R: Linkage and Usage

Utilize IBM SPSS Statistics and R to Produce a Combination Correlation Table and Graphs
IBM SPSS Statistics is very powerful software that allows complex data analyses to be performed. R is a very useful software environment that provides a coding language tailored to statistical operations. This article will give an outline of the procedure to enable the use of SPSS Statistics and R to add even more functionality to the use of SPSS Statistics. The example that will be used is generation of a combination correlation table and various graphs using this integration.
There are three major points to be discussed throughout the article:
- Using SPSS Statistics and R together creates a very potent solution, but setting this up is quite involved.
- An eight-part video tutorial series from the Ironside Group is available to help walk through the setup and use of R within SPSS Statistics.
- The example correlation table and graphs are helpful in conducting a thorough multiple regression analysis.
In order to set the stage for detailing the first two points, the third point will be treated first.
Correlation Table and Graphs
When conducting a multiple linear regression analysis, it is generally important to check the independent variables for collinearity (also referred to as multicollinearity). This is especially true if a subset of the variables will be used in the model and/or their coefficients are to be used in decision making (e.g., coefficients to be used to determine key drivers or “importance”). There are a number of ways to investigate possible collinearity, such as checking variance inflation factors (VIF). At a minimum, a correlation table can be constructed that shows correlations between pairs of independent variables.
Since the usual correlation table shows the Pearson’s r correlation coefficient between each pair of independent variables, each independent variable in the table should be either interval- or ratio-level data. Also, the generation of the table should have the provision of using pairwise data or listwise data. Pairwise data use all available data for each pair of variables. Listwise data use only those cases (records) that have data values for all variables in the table. There are advantages and disadvantages to either approach. To generate the table, the selection of either should be an option.
The correlation table is, essentially, a mirror of itself (meaning that its bottom left corner yields the same values as its upper right corner). As a result, replacing the redundant values in the upper right portion of the table can be done without a loss of information. Additional insight can be gained by replacing those values with a scatterplot of the corresponding row and column variables. Further, the diagonal of the correlation table shows the correlation of each variable with itself, a correlation value of one. So, the diagonal values can be replaced with a histogram of the corresponding variable. An additional modification that can be helpful when interpreting the table results is making the font size of each correlation in the lower left part of the table proportional to the absolute value of the correlation, making the stronger correlations stand out more than the weaker correlations.
The resulting correlation table with graphs gives the correlations in order to investigate collinearity, scatterplots to check for non-linear patterns between variables, and histograms to check normality assumptions about each of the independent variables in the table. An example of this correlation table and graphs is provided below. As can be seen, there is a rich and varied amount of information given in this output.
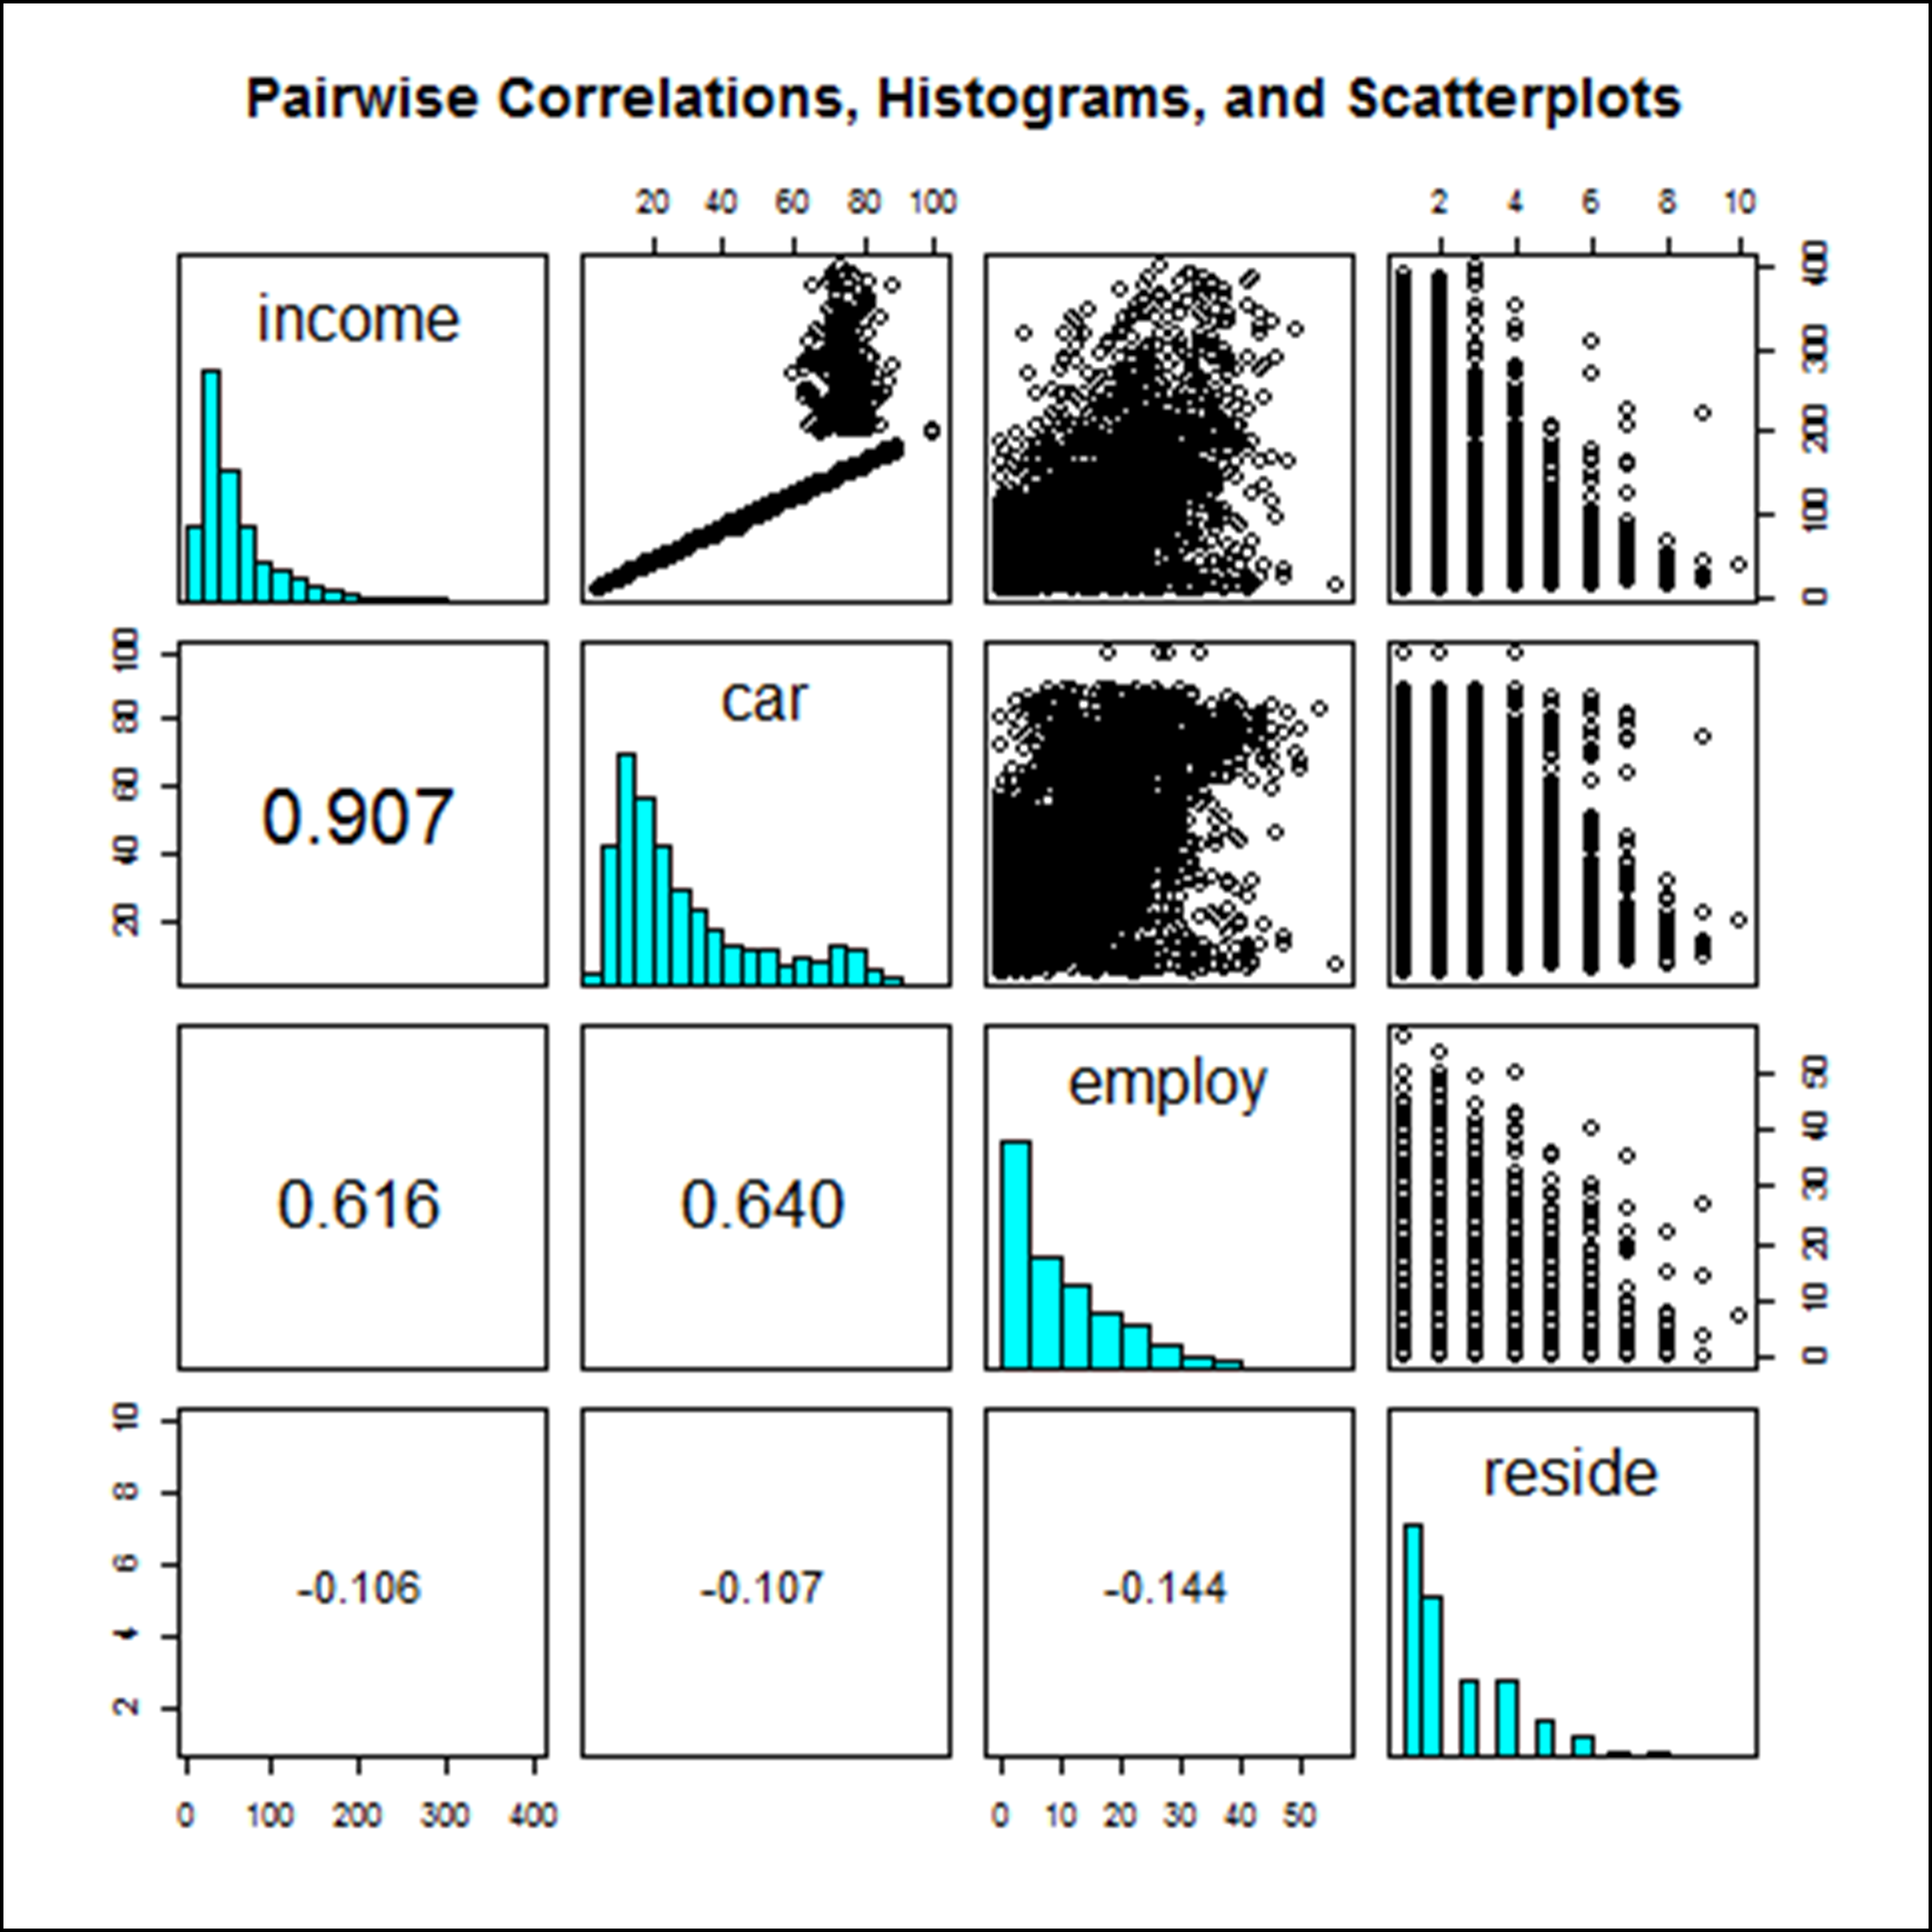
This type of graph has been modified from an example given as part of the pairs() package in R. Typing pairs() from within R shows the similar setup.
Wouldn’t it be great if this correlation table and graphs could be obtained from within IBM SPSS Statistics? Further, wouldn’t it be even better if the correlation table and graphs could be obtained through one command extension entered in the SPSS Statistics syntax window and/or by pointing and clicking using a custom dialog as part of the menu? The methods used to achieve these beneficial enhancements through pairing SPSS Statistics and R are discussed next.
Linkage and Usage between IBM SPSS Statistics and R
IBM SPSS Statistics is a general purpose software package. It is used to perform a number of statistical analyses (like inferential statistics and modeling). The software conducts these analyses using a syntax-based and/or menu-based approach to specifying commands. These two approaches are linked together in an easy-to-use manner.
R is an open-source software environment that allows for very versatile statistical analyses. The techniques that are available are cutting-edge. R is extensively used in communicating statistical concepts. Its graphical capabilities are impressive. Despite this, however, it can be quite difficult to use since programming with it can be both time-consuming and challenging.
If someone were to ask, “Which software should I use for statistical analysis, IBM SPSS Statistics or R?” the answer would be “YES!” If the capability is present to do both, then the strengths of each can be used. Further, if both can be linked, as opposed to being used separately, that’s even better. For example, once built, the R-based correlation table and graphs could be generated within the SPSS Statistics syntax window through the use of an extension command like the following:
ISGCORRTABLEGRAPHS VARIABLES = variable list
/OPTIONS MISSING = { PAIRWISE** }
{ LISTWISE } .
In addition, a custom dialog could be set up which could execute the R code within SPSS Statistics by simply pointing and clicking through the main menu. The dialog could look like the following:
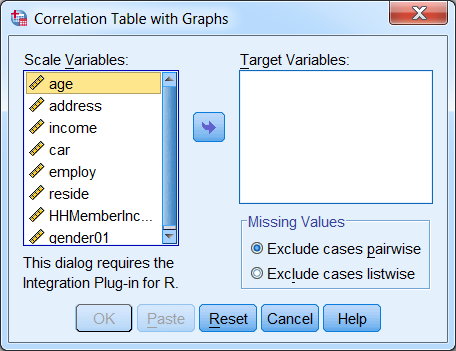
Note that enabling the capabilities to link and use SPSS Statistics and R together, as well as producing extension commands and custom dialogs, is quite involved. Fortunately, there is a step-by-step process available. When followed, the result will be greatly enhanced capabilities within SPSS Statistics through the use of R.
Tutorial Series for Linkage and Usage of IBM SPSS Statistics and R
IBM SPSS Statistics documentation is generally both extensive and impressive, but the documentation describing the steps and potential pitfalls related to integrating SPSS Statistics and R is incomplete. This is particularly a problem because of the complexity involved in linking these two software packages. For this reason, Ironside created an eight-part video tutorial series that assists in navigating through the maze of steps.
The eight tutorials can be placed into two groups. The first four tutorials involve installation of R, R-related software, and software to set up and enhance capabilities of SPSS Essentials for R. Specifically, the first tutorial serves as an introduction to the series and steps through installing the proper version of R (e.g., older version of R, 2.14.2, if using IBM SPSS Statistics 21). The second tutorial covers installation of software that helps use R (Notepad++, NppToR, RStudio, and Tinn-R). Different analysts may prefer one software package over another for different situations, so instructions for all are given. The third tutorial covers installation of software that documentation suggests should be installed in conjunction with SPSS Essentials for R (Rtools, MiKTeX, HTML Help Workshop, and MS Visual Studio 2008). The fourth tutorial covers the actual installation of SPSS Essentials for R and covers important related topics/activities. As part of the fourth tutorial, the following is done: preparation for SPSS Essentials for R installation, SPSS Essentials for R resources, SPSS Essentials for R installation, update of various R packages, R plug-in verification, R plug-in example, and showing additional R plug-ins.
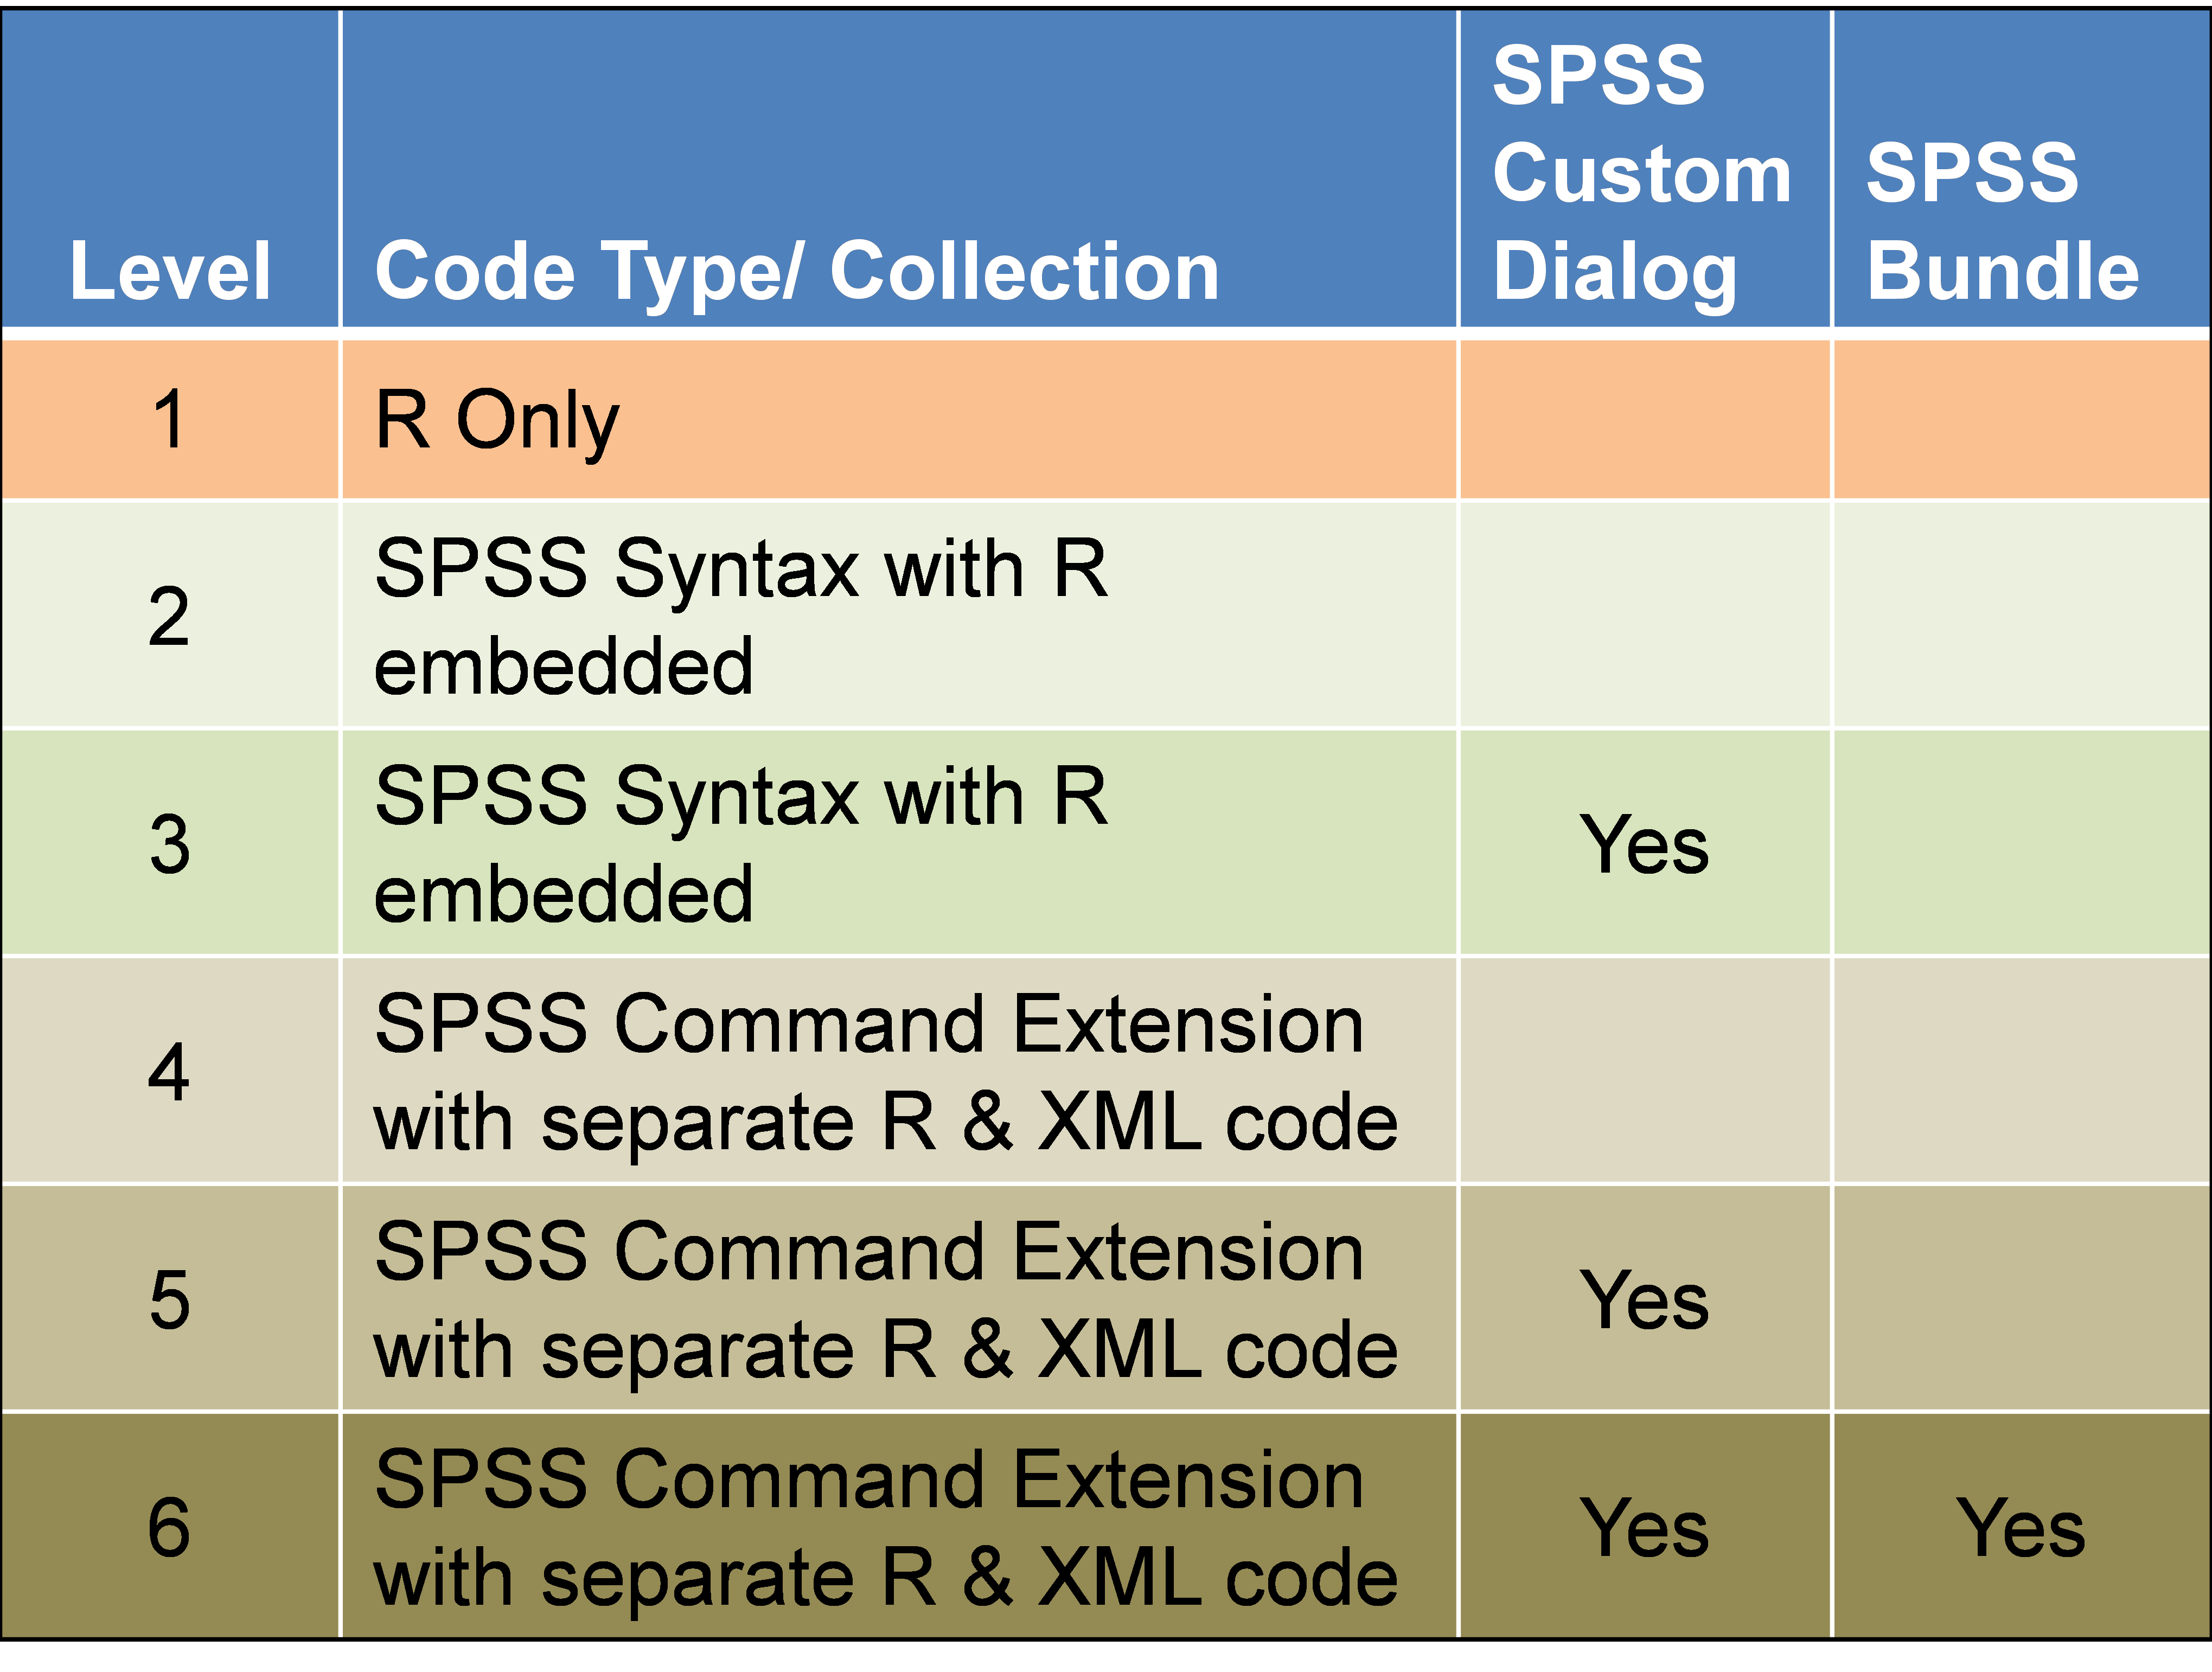
The second group of tutorials covers the six levels of integration between SPSS Statistics and R. These levels build on previous levels and get increasingly complicated. The levels vary in the manner with which R code is incorporated into SPSS Statistics and also involve building custom dialogs and/or command extensions and/or bundling. Because of this, the tutorials also cover building custom dialogs and producing command extensions as added benefits. The integration levels are summarized below.
In summary, the eight tutorials are:
1. Introduction and installation of R.
Introduction to tutorial series and steps to install proper version of R.
2. Installation of R-Related software.
Installation of software that is helpful to constructing R code.
3. Installation of software related to SPSS Essentials for R.
Installation of software to enable full capabilities of SPSS Essentials for R.
4. Installation of SPSS Essentials for R.
Installation of SPSS Essentials for R and coverage of related activities.
5. SPSS-R integration levels 1 and 2.
Coverage of R only and SPSS syntax with R embedded.
6. SPSS-R integration level 3.
Coverage of SPSS syntax with R embedded along with Custom Dialog.
7. SPSS-R integration level 4.
Coverage of SPSS Command Extension with separate R and XML code.
8. SPSS-R integration levels 5 and 6.
Coverage of SPSS command extension with custom dialog and bundling into .spe file.
The tutorial sessions average about 30 minutes (each session is between 20 and 40 minutes in length). Since the sessions are in video format, they can be stopped and started to conform to each viewer’s pace. The tutorials are quite narrative, so they can also function as a manual. Extensive detail is given for each step so that no important nuance is left out. The step-by-step process is set up for a laptop/desktop computer using Windows 7 with sufficient hard drive space and computing power, an Internet connection, and IBM SPSS Statistics 21 installed.
The end result of completing the series is the capability to use SPSS Statistics and R together through the sixth level of integration in which R code could be developed, an extension command produced, a custom dialog set up, and a bundled .spe file put in place. The enhanced capabilities can then be given to other SPSS Statistics users. The custom dialog and command extension presented earlier for the correlation table and graphs serves as an example of using the synergy offered by using SPSS Statistics and R.
These videos are available as a free one day course on SPSS and R. Complete the following form to access these videos: