Building Effective IBM Cognos Active Reports: Part 1
Active Reports are a new type of report in IBM Cognos 10 that combine data and layout into a single file. This file can be distributed and viewed offline, allowing reports to be reviewed “on the go”. Active Reports also contain a great deal of animation and display functionality, making them ideal for dashboards and other high-level reports where style and graphical sophistication are important.
The basic components of an Active Report are the same as any other Report Studio report – lists, crosstabs, charts, etc. However, the way these components communicate and interact with each other is completely new. Designing an Active Report requires an understanding of these interactions, and of how Active Reports are generated by the Cognos report service.
Active Report Variables
Active Report elements communicate using Active Report Variables. While there are many types of functionality that can be created, all active report interaction features are based on two types of communication:
–Set a variable when the user interacts with a control (select a drop down, click on a chart element, etc.)
–React to a variable being set (select a card, filter a list, enable a button)
Setting a variable is simple – when the data on a control changes, a variable is set to a value corresponding to that change. This could be a data item in a drop down or on a chart, or a static text item related to a menu bar.
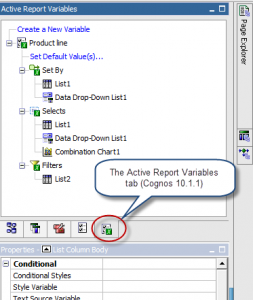
Reacting to a variable being set is more involved. Cognos knows whenever a variable is changed, and keeps a list of each report object which is affected by that variable. For each object, Cognos also knows what to do with the variable value: filter the object, select part of the object, or enable/disable the object. (In Cognos 10.1.1, this list is available for each Active Report Variable on the Active Report Variables tab in Report Studio.)
Whenever a variable changes, Cognos automatically updates all of the objects affected by that variable. Each report can have as many of these connections as it needs – a dynamic Active Report may end up having a complex web of variable-based interactions.
Creating Connections
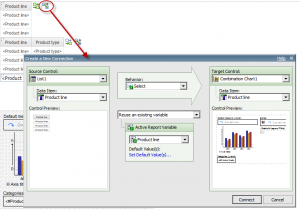
To make Active Report creation easier, Cognos adds a “Create a New Connection button” and dialog to Active Report objects. While this can be a quicker way to get a report up and running, it does nothing that goes beyond setting and reacting to changes in Active Report Variable values.
There are no hidden links or metadata involved in creating connections. In fact, creating a connection is just a shortcut for several independent actions:
1.Create a new Active Report Variable (if necessary)
2.Set a variable to a value from the Source Control
3.Have the Source Control react to that variable by selecting on it
4.Have the Target Control react to that variable by selecting or filtering (depending on which was chosen)
You can achieve the same effect by creating an Active Report Variable, then editing the Interactive Behavior for each report object separately. (To verify this, examine the Interactive Behavior properties before and after creating a connection – then try doing it through the Interactive Behavior dialogs alone.) If a data drop-down filters three different lists, it’s easier to create a connection from the data drop-down to the first list, then edit the Interactive Behavior for the second and third lists to react to the same variable that the first list is using. This can create powerful dashboard controls where the user can change the entire screen by making a single selection.
Active Report Generation, Decks and Tab Controls
When Cognos creates an Active Report, it takes all the data and graphics needed to display all screens in that report and packs them into an MHTML file (the “.mht” file that is saved to Cognos). This means that:
-All data for lists and crosstabs is aggregated and stored in the file (including all calculations)
-All charts are pre-rendered and stored in the file
Active Reports cannot create new charts “on the fly” – they must all be created ahead of time and stored in the file. To address this fact, you as the report designer need to consider what charts will be useful, and design the Active Report to include all those charts.
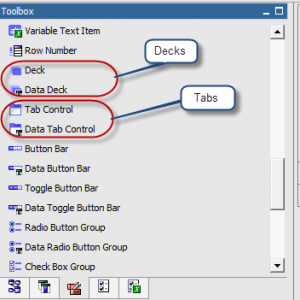
To enable this (among other things), Cognos provides two new report objects for Active Reports – decks and tabs. Each of these controls creates multiple “cards” that the user can switch between. The main difference between the two is that tabs have a built-in tab interface at the top (like tabs in a web browser), while decks do not. There is a “Data” version (Data Deck, Data Tab Control) and a static version (Deck, Tab Control) of each.
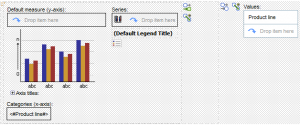
The data-driven version is useful for creating multiple charts around a particular data item. The control will create a separate card for each unique data value. All cards share a single layout, but report objects on the card can use a master-detail relationship with the control to limit what data is displayed.
(A Data Deck with an embedded chart, using Product Line for its values)
For example, a Data Deck with “Product Line” for its Values will create a card for each Product Line value (Camping Equipment, etc.). A chart within that Deck with a master-detail relationship on Product Line will be filtered automatically, so that each chart will only show data for the relevant Product Line. When generating the Active Report, Cognos will pre-render a separate chart graphic for each Product Line and include them all in the Active Report file. By allowing users to switch between cards, you can create the appearance of dynamic chart creation.
NOTE: If there are a larger number of distinct values for a data deck or tab control (for example, every day for a five year period), the Active Report will become very large and may fail to load.
In Part 2 of this series, we’ll discuss how to use static decks and tab controls to simulate drill through functionality and several other interesting features.


