Create an Active Report with a Data Deck
With the introduction of Active Report, IBM Cognos 10 report designers now have the ability to quickly and effectively create dynamic, powerful, interactive, self-contained reports available offline and on the go, which are highly sought after by report consumers.
Active Report’s intuitive, drag and drop interface makes it incredibly easy to add interactivity and functionality to reports, including variable text items, tab controls, and data decks.
To illustrate the ease of use, this tutorial will walk you through the steps for creating a simple report containing a data deck in Active Report. Data decks allow report developers to add modern and visually appealing animations to reports. Using master-detail relationships, a variety of data containers can be inserted into a deck and updated to show only values selected in an Active Report control.
The process is as follows:
- Launch Report Studio with the Go Sales (Query) package and create a new report using the Active Report template.
- From the Insertable Objects Toolbox drag and drop a Data Button Bar into your report.
- Drag and drop a Data Deck beneath the Data Button Bar.
- Drag and drop a Column Chart inside of the Data Deck.
-
On the Insertable Objects pane, select the Source tab and drag and drop the following data items from the Sales (query) namespace:
- Insert Time.Year in the Data Button Bar button label and sort it ascending.
- Insert Sales.Revenue into your chart as the default measure.
- Insert Products.Product Line as the categories.
- Right-click the Chart and select Go To Query. Add Time.Year to the data items list of this query.
- Return to Page View and click the Interactive Behavior icon (
 ) beside your Data Button Bar and select Create a New Connection… on the subsequent screen.
 - Ensure that on the source side (left) of your connection the Data Button Bar1 control and the Year data items are selected. The connection method should be Select and you will create a new active report variable named Year Variable1. On the target side (right) of your connection, the Data Deck1 control is selected and the Data Item option should show Copy Data Item from Source.
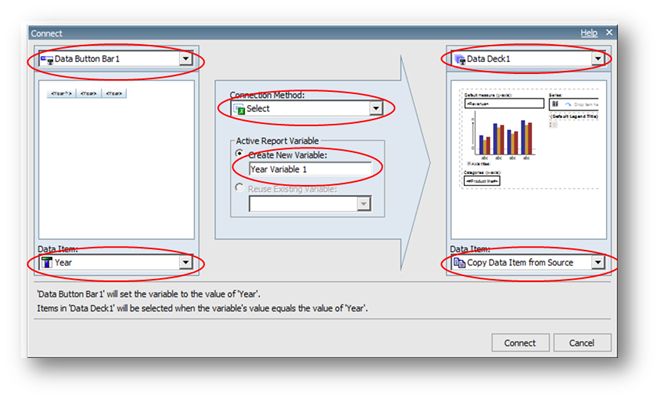
- Once confirmed, click Connect and click OK on the originating screen.
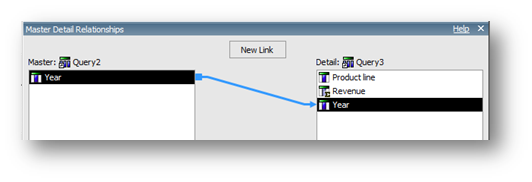
- Right click the chart and select Master Detail Relationships and create a New Link between the two queries on the Year data item. If Year is missing from your right side (chart) query, ensure that you completed Step 8 correctly.
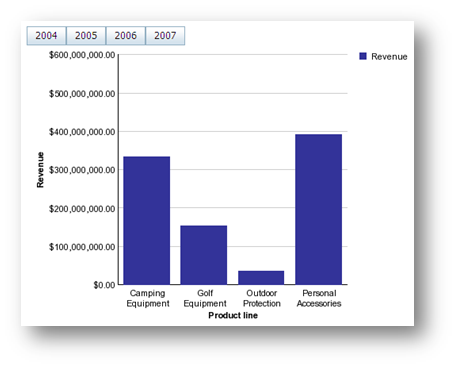
- Click OK and save your report as Demo 5 – Data Deck in My Folders. Your report should look like the following:
This tutorial illustrates just one of the new and exciting capabilities available to Active Report designers. For additional training, Ironside Group offers a one-day Active Report training course that provides a comprehensive review of the tool and all the relevant features and functionality. Contact us today learn more and reserve your spot in one of our upcoming classes.