Having Trouble With Your Data Strategy? Then Map It.

When asked “What’s your data strategy?” do you reply “We’re getting Hadoop…” or “We just hired a data scientist…” or “If we only had a data lake, all our problems would be solved…”? Plotting a good data strategy requires more than buying a tool, hiring a resource, or adding a component to your architecture. You need something to describe:
- the goals you are trying to achieve,
- the stakeholders you are trying to serve, and
- the internal capabilities required to satisfy those stakeholders and achieve those goals
There are plenty of tools to help you optimize specific portions of your data strategy but the challenge is pulling everything together to define the strategic choices you need to make. Ironside has developed a framework – based on a proven strategic planning concept – to help you clarify these choices and build a winning data strategy.
Form Your Strategy
In the Fall of 2000, the Harvard Business Review published “Having Trouble with Your Strategy? Then Map It” by Robert S. Kaplan and David P. Norton. This article defined their concept of a Strategy Map – a one-page depiction of an organization’s strategy across four perspectives – and outlined the process that strategy teams can use to create a Strategy Map to define or clarify their company’s strategy. Strategy Maps are a core component of the Kaplan & Norton Balanced Scorecard for Strategy Execution framework, which has become a widely-used technique for managing strategy.

For many organizations, the formulation of an effective strategy involves not only setting a financial target – “We want to be a $2B company by 2020” – but also making lots of choices to support that target: what products to offer, what customer segments to target, and what value proposition will differentiate you from competitors. It also requires a company to identify the internal processes that need to be optimized to support those goals, and the people and skill sets required to execute those processes effectively. Strategy formulation is more than specifying a simple financial target or describing a terrific product feature; it’s a holistic set of aligned objectives designed to achieve an organization’s overall goals.
A strategy map uses four perspectives – Financial, Customer, Internal Processes, and People – to articulate the different objectives that comprise this holistic view. When designed properly, a strategy map allows you to “tell the story” of your strategy by defining the cause-and-effect relationship of the objectives across the four perspectives and ensures that business outcomes are more likely to be achieved.
While the strategy map framework is useful for clarifying an organization’s overall strategy, it can also be used when a company is trying to clarify its data and analytics strategy. Business Intelligence and Analytics continue to grow in importance and many organizations struggle with the choices necessary to both define the proper strategy to meet their objectives and improve their analytical capabilities. Ironside has developed a Data Strategy Map to refine, organize, and clearly articulate these choices.
Figure 1 shows a simplified version of our Data Strategy Map. The remainder of this article will describe the structure of the map and provide an overview of how it is used. In future articles, we will expand this overview and provide details on the methods and techniques behind each of the four perspectives.
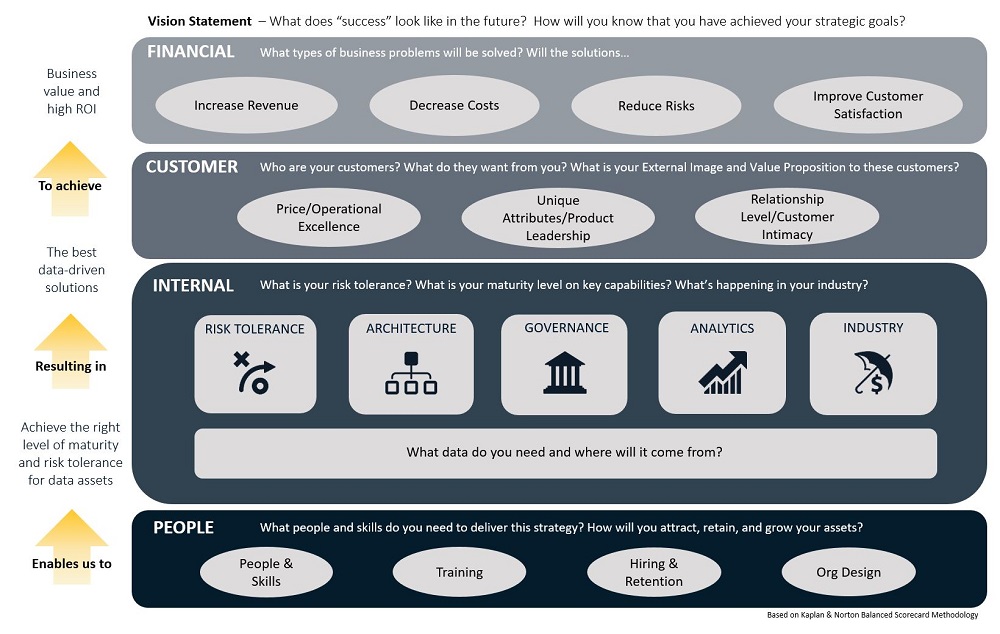
Figure 1
Overview
The Data Strategy Map uses four perspectives to collect and arrange the different objectives of your data strategy. These objectives describe specific things that must be accomplished as part of the overall strategy and include measures to determine when they have been achieved. There is a cause-and-effect relationship between the perspectives – the People and Internal perspectives describe the internal capabilities and skills necessary to yield the outcomes in the Customer and Financial perspectives.
Once the map is completed, and the objectives clarified, the map can be used to “tell the story” of your strategy by summarizing the information in each perspective. This story can be told from the bottom-up or from the top-down; the example shown summarizes the story from the bottom up. A vision statement, at the top of the map, summarizes the future-state goals of the data team.
Financial Perspective
Data strategies are developed in order to support reporting and analytics capabilities throughout your organization, especially in situations where you may be expanding your traditional BI capabilities with advanced analytics. The ultimate goal of these analytics efforts is to solve business problems and realize the business benefits of doing so. These business benefits typically fall into four different categories: increasing revenues, decreasing costs, minimizing risk, or improving the customer experience. (Note that our example map shows four objectives; each organization’s financial objectives may be different).
Identifying objectives in the Financial perspective requires the team to ask themselves “What type of financial benefits will these analytics solutions provide, and can we quantify those benefits?” For example, you may be interested in building a predictive model to understand customer churn. If you are able to reduce churn by 2%, what is that worth to your organization? The resulting collection of objectives and measures in the Financial perspective is a powerful way to illustrate the bottom-line impact of your analytics initiatives and build a solid business case for implementing your overall data strategy.
Customer Perspective
Although the primary focus of this perspective is the group of internal stakeholders involved with your data and analytics efforts, rather than end-consumers of your company, the same questions apply: who are your customers, what are they looking for, and what is your value proposition to them? Perhaps you have end-users who want to eliminate hard copy reports and move to online dashboards to reduce costs and improve efficiency. Or a department that needs help leveraging large datasets and machine learning algorithms to build unique predictive models. You may even be moving to a self-service analytics model and need to fundamentally change your support model for business unit users. Your data strategy needs to be comprehensive enough to support the requirements of all stakeholders, and clarifying those requirements in the Customer perspective will ensure that your internal capabilities are adequate.
Internal Perspective
This perspective describes the key internal processes that organization needs to optimize in order to achieve the strategy.
In our Data Strategy Map we identify seven different categories that are critical to success and use the map to determine the capability level required in each one. The strategic choice, then, is not whether you need these capabilities but rather how mature your organization needs to be in order to execute your strategy.
For each category in this perspective, we use the map to identify the gap between current and future-state capabilities and measure your progress toward achieving those future-state objectives.
People Perspective
The final perspective in the Data Strategy Map is used to identify objectives related to people: what types of skills are required and how will you attract, hire, and retain this talent? Additionally, data strategies often include new skilled groups – like a governance team – that must be supported with the proper organizational structure. This perspective completes the map by identifying the people-related items necessary to implement the strategy.
We have found this tool to be an effective way to compile and articulate the various components of a good data strategy. In future articles, we’ll dig into the details behind each perspective and the process to build an effective Data Strategy Map. Contact us today for more information or for help with mapping your data strategy.

About Ironside
Ironside was founded in 1999 as an enterprise data and analytics solution provider and system integrator. Our clients hire us to acquire, enrich and measure their data so they can make smarter, better decisions about their business. No matter your industry or specific business challenges, Ironside has the experience, perspective and agility to help transform your analytic environment.

