Overview of IBM Cognos BI 10.2 System Metrics

IBM Cognos Business Intelligence platform has built-in monitoring systems that gather different metrics on each service, dispatcher, server and server group. These system metrics provide better insight into the status and overall health of a Cognos BI environment. The performance of these system metrics play a key role in tuning a BI environment to its full potential.
The metric values are live (real time) and reside in an MBean in the Java environment. The metric can be reset manually from the administration console or can refresh whenever the IBM Cognos BI service/process is restarted. There is no auto-refresh feature available yet, but there is a refresh button available in the toolbar.
IBM Cognos BI System metrics are displayed under the System task in the administrator console. To view the metrics:
- Launch IBM Cognos Administration with IBM Cognos Connection
- Click the Status tab and then click the System task.
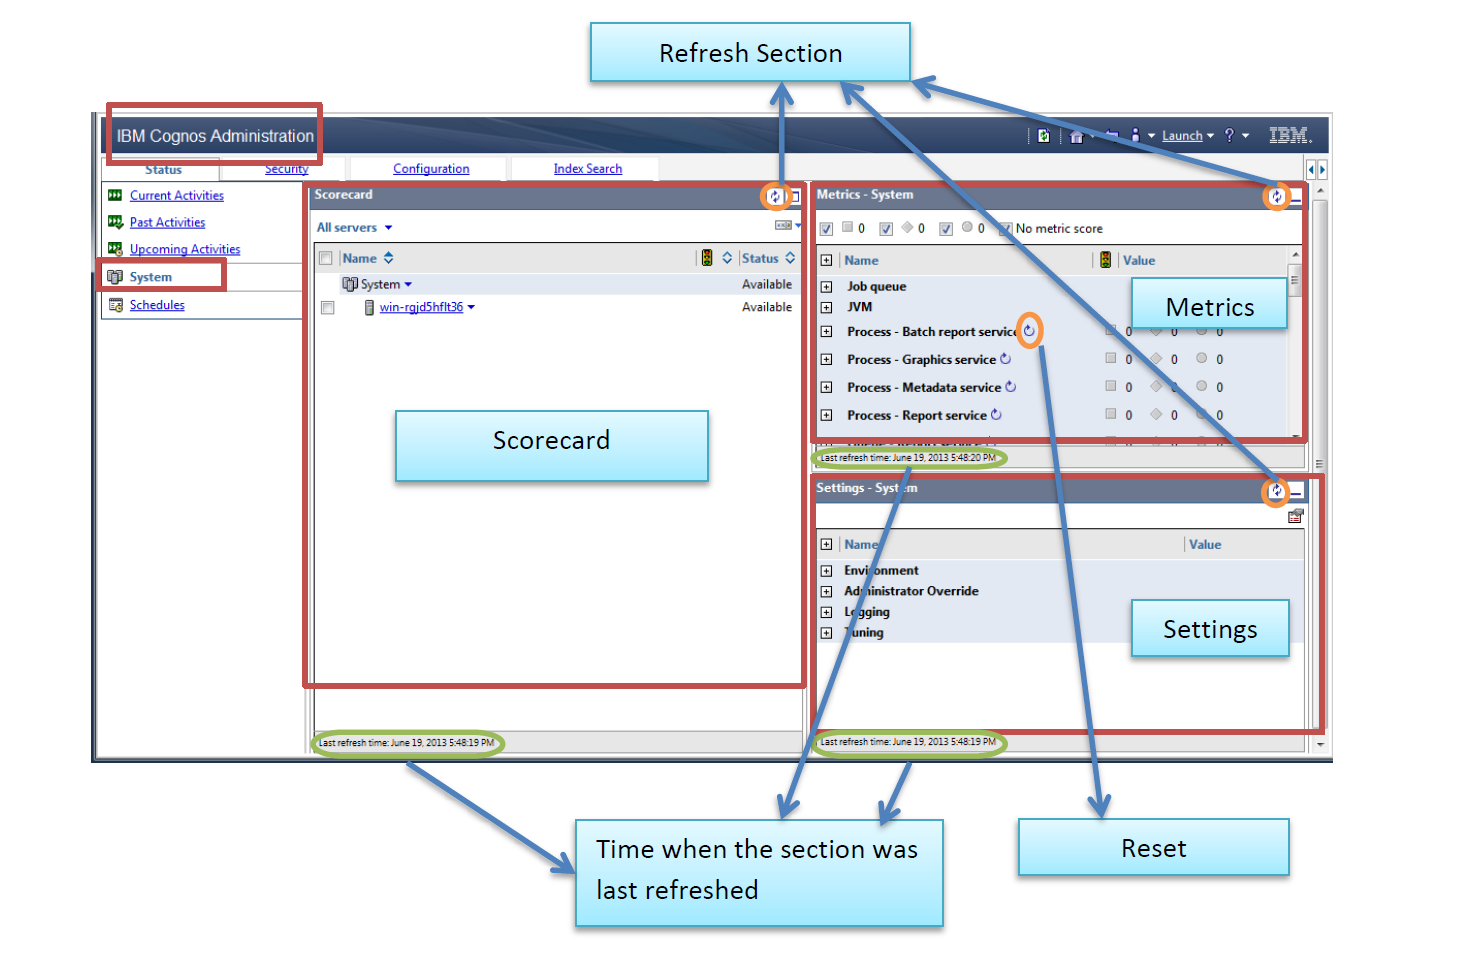
The system task interface is divided into three segments:
- Scorecard: Left hand section displaying a summary of the overall health of the components that make up the environment.
- Metrics: Upper right hand section displaying a list of all the metrics and their score.
- Settings: Lower right hand section displays a read-only view of the configuration parameters.
The following are possible statuses display in the Scorecard section:
- Partially Available – Indicates that one or more of an object’s children are offline.
- Available – Indicates that the object is online.
- Unavailable – Indicates that the object is offline.
The underlying dispatcher(s) and service(s) can be viewed by drilling down on the server name, which reveals the objects running on that server.
The Scorecard panel can also be filtered using the down arrow icon beside the All servers object.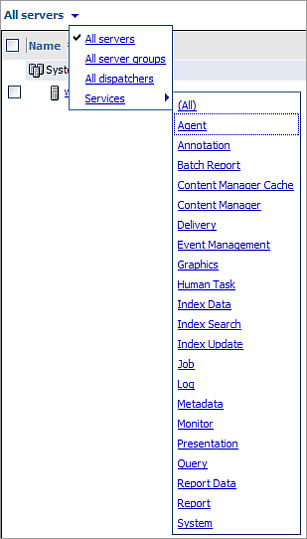
There are two views available in the scorecard section, the default view and the comparative view. The default view or standard view allows administrator to navigate through the system topology to verify the health and metrics of different components. The comparative view provides the ability to compare system metrics. It is very useful within a distributed Cognos BI environment. To access this view, maximize the scorecard frame by pressing the expand icon. This will maximize the frame within the console and provide the comparative view.
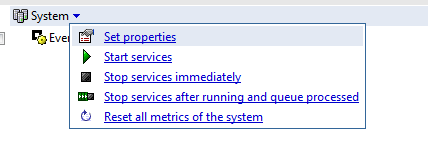
All metrics can be reset manually by selecting the Reset all metrics of the system option available under the System dropdown.
 The system metrics are broken into three dimensions: individual metric, metric group, and service. The individual metrics are divided into three main metrics groups – Request, Queue, and Process. The complete list of individual metrics contains some that have numerical values and timestamps, but the following are most of the individual metrics that have numerical values.
- Average Time in Queue
- Failed Request Percent
- Last Response Time
- Milliseconds per Successful Request
- Number of Configured Process
- Number of Failed Requests
- Number of Processed Requests
- Number of Processes
- Number of Received Requests
- Number of Requests
- Number of Sessions
- Number of Successful Requests
- Queue Length
- Service Time All Requests
- Service Time Failed Requests
- Service Time Successful Requests
- Successful Request Percent
- Successful Request Per Minutes
- Time in Queue
- Uptime
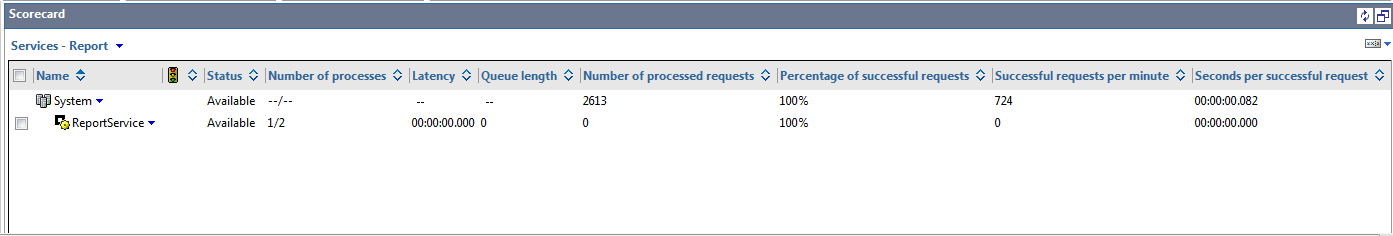
The Request metric group contains metrics pertaining to the specific requests that are handled by each component in the environment. These represent the amount of processed requests, the percentage of successful versus failed requests, and the amount of processing time for requests.
The Queue metric group contains metrics that provide insight into the amount of requests that are not handled immediately and therefore placed into a queue to be processed when the resources become available. Such metrics represent the amount of requests that have been in the queue, the length of the queue as well as how much time requests have spent in the queue.
The Process metric group contains metrics that display information regarding the amount of processes. Such metrics display the number of current processes as well as the maximum number of processes.
The system metrics associated to each service are displayed in the final dimension Services.
These system metrics are very useful in determining the health of BI environment. Some of the examples are:
- The Current heap size (bytes) metric helps in determining the set JVM heap size of the environment.
- The Uptime metric helps you determine the how frequently Cognos is restarting one or more components.
- The Number of failed requests metric indicates when to perform a health check on your BI environment.
- The metrics belonging to the Process group show how efficiently the BI environment is utilizing server resources.
- The Number of sessions metric provides the number of currently active user sessions.
The system metrics provide great help in monitoring the performance and availability of IBM Cognos BI environment. The appropriate monitoring of these system metrics helps in configuring and designing efficient IBM Cognos BI environment. These system metrics can be accessed externally by enabling the JMX interface. The thresholds (high, middle, and low values) can be set for each metric to display red, yellow, or green traffic light indicators.
If you’d like to know more about how to monitor and maintain your Cognos BI environment, the Ironside Business Intelligence team can help get you up and running. Our experts will show you the metrics that are most important to track and will prepare your internal resources for managing your infrastructure.