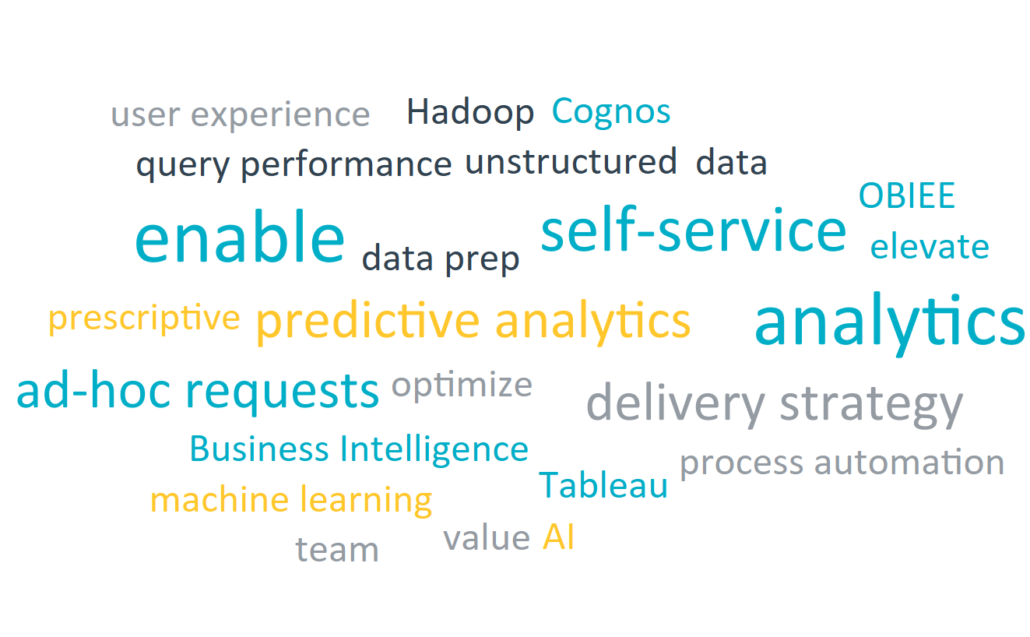
Is “Self-Service” Analytics the New “Big” Data?

Last spring, I had the opportunity to attend a local analytics conference with Dr. Claudia Imhoff as the keynote speaker. As she got on stage to begin her presentation, she started out by making a statement along the lines of “For every time the phrase ‘Big Data’ is mentioned today, we will all take a shot during happy hour.”
(Tip: Don’t try that for this article.)
What is Big Data?
Big Data is an ever evolving and somewhat mysterious term, referring to data that is characterized by a set of properties known as the “V”s. There are between 3 and 10 Vs, depending on your source. The most common ones are Volume, Velocity, Variety and Veracity.
Volume: The scale of the data. There is no hard and fast rule for what is considered “Big” when it comes to volume, but there has been a shift from sizing data storage in terms of Gigabytes and Terabytes to Petabytes and even Exabytes. IBM forecasts that by 2020, 40 Zettabytes of data will have been created1 – 300 times the number in 2005.
Velocity: This refers to not only the speed at which the data is being created, but also the time frame between data generation and analysis. From the Volume description, it is evident that data is being generated more rapidly in recent years, and therefore needs to be captured and stored correspondingly so, but it is becoming increasingly necessary to be able to distinguish insightful data from the rest on the fly, which introduced the concept of streaming analytics.
Variety: The structure of the data. Pre-2011, most data used for reporting and analysis was from operational systems and was stored in transactional or relational databases. Smart phones, Web 2.0, and the Internet of Things made new types of data available and relevant, but these new data types – clickstreams, social media content, videos, sensor readings, etc. – don’t fit into rows and columns, and are known as unstructured (or semi-structured).
Veracity: The quality and trustworthiness of the data. Poor data quality costs the U.S. economy around $3.1 trillion per year.1 Data quality is certainly not an issue specific to unstructured data or datasets larger than a terabyte, however the other Vs noted do magnify this issue.
With all of this outlined, the term “Big Data” nowadays is most relevant as a buzzword to capture attention, funding, or to distinguish unstructured data from that stored in a typical reporting Data Warehouse. While Big Data was a Big Deal around 8 years ago, in most organizations today, it is simply “data.” The ability for organizations to generate, capture, acquire, and store exponentially larger volumes of data, structured or unstructured, means that “Big” data is now often the norm rather than a novelty when it comes to leveraging data for new insights and innovation.
In fact, if your organization has a comprehensive and sound Data & Analytics strategy – addressing key areas including governance, skills, and architecture – success leveraging data to drive business decisions, regardless of volume, variety, veracity (or any of the other “V”s), is bound to follow.
The Need for Self-Service
Self-Service Analytics, the enablement of business stakeholders to access and analyze data independently of a central BI team’s support, has been another common initiative that we’ve seen and heard our clients struggle with.
The conversation typically goes one of a few ways:
“We’ve just implemented Tableau but we are still relying on a small central team for the majority of dashboard development. How do we enable the masses within our organization to create and share their own content while following regulations or guidelines around security, data definitions, source of truth, branding, and efficiency?”
or
“We’ve rolled out PowerBI to several hundred business analysts across the enterprise, and they’ve all started creating content, but we are seeing a lot of duplication, inconsistency, and poor adherence to proven practices. It’s chaos.”
or
“Marketing wants to use Amazon QuickSight for data visualization, but we have similar capabilities in Cognos – our enterprise BI standard – how do we get them on board with using the tool we already have?”
Note: The tools referenced here are for anecdotal purposes only, as all of these situations apply to any platform or platforms that an organization might select as their analytics weapon(s) of choice.
The challenge is a common one, and has become more visible and business impactful in recent years as the use of analytics as a differentiator and the availability of technology to support that shift pushes organizations to enable business stakeholders, who know the most about the problems they need to solve, to address those problems and questions more and more quickly. In fact, Gartner forecasted last January that by this year, self-service users would create more analytic content than data scientists.2
These trends and statistics beg the question posed in the title of this article. Is Self-Service the new Big Data? Can organizations truly enable self-service analytics as a standalone initiative, or is it simply the new normal, i.e. something that every organization should be considering and addressing in their Data & Analytics strategy, and that will be inherently enabled in doing so?
For the remainder of this article, let’s take the position of the latter and explore the parallels between Big Data and Self-Service Analytics in this regard.
Why Is Self-Service So Challenging?
To really hit the parallels home here, let’s use the four Vs we described as Big Data qualifiers to explain why enabling a significant community of users to leverage data on their own to answer business questions is so challenging.
Volume: So. Many. Users. You can’t possibly give them all access to everything. How do you know who needs what? How do you train them all? There’s a lot of software licenses to pay for if they all have the ability to create their own analytic content. And how do you manage the content that they’re creating? There’s going to be a lot of duplication, and inevitably a large volume of content will get saved and then never used again. How will you know what’s important when it’s time to test for an upgrade or OS migration or any other change that could have an impact?
Understanding the user community, the capabilities that different groups of users require, and the desire they have to leverage data and technology will be a key foundational step. In addition, ensuring you have appropriate data and content governance policies and processes will help keep things running smoothly.
Velocity: This content needs to be created quickly. Like, yesterday. If there was time to spare, they would have submitted a request to the central team to have something created instead of doing it themselves. But, Andrea in Marketing just got asked a question by her SVP in a planning session about webpage views by country, which is not something that’s on an existing report, and this needs to be answered in the next 10 minutes. This is less of a challenge of enabling self-service than it is the driving factor.
The challenge is in the fact that Andrea is going to find a way to get this answer in one way or another, because she’s intelligent, resourceful, and understands the urgency behind the request. She’s probably going to have to ask somebody to send her some web analytics data in a spreadsheet. She knows the timestamps will be wrong because there’s some kind of time zone logic that needs to be applied and she’s not quite sure about that, so she’ll have to involve a couple other people, and replicate that manually, but she’ll get the answers. Hopefully they’re correct.
The longer organizations wait to ensure their business stakeholders have adequate analytic capabilities and access to data, the more overhead is incurred by delaying time to insight.
Variety: In regard to the scenario above, Andrea’s got this under control. She knows there’s a Data Source on Tableau server that is used to create her weekly Marketing KPIs, and although “country” is not a dimension on the KPI Dashboard, it’s available in the data source. She’s very proficient with Tableau Web Authoring, so she can connect to the data source and with a few clicks she’ll have a nice column chart showing her the information that’s needed to influence this decision (no time zone logic to worry about either, that’s already done in the data source).

But not everybody is as knowledgeable as Andrea. And not everybody is a Tableau user. Bill in Finance wants to use PowerBI. He has been using Excel for 20 years, and wants to take advantage of the visual and dashboarding capabilities that another tool can offer, and to him, the PowerBI interface is very similar to the Pivot Tables he is so familiar with. To learn a completely new platform and migrate his Excel processes would be such a burden to him that he would rather keep doing them manually (Andrea on the other hand, is more comfortable with the crisp, clean visuals she gets using Tableau and often uses them to create customer-facing marketing materials as well).
Supporting a standard enterprise platform for analytics simplifies support and in theory, a lower total cost of ownership. However, when considering factors like adoption of analytics, time to insight, and overall business efficiency, focusing on a strong data management and governance-oriented foundation while allowing the business community to leverage the tools that satisfy their varying analytic needs is a more effective approach in the long run.
Veracity: Andrea and Bill are now on the same project team and are in a workshop together where the team is working to come up with ad revenue projections that will help them forecast the ROI of this project as part of their project charter development. They want these projections to look good so that they can get the funding the project needs, but they also need them to be reasonable and accurate because performance against these projections will be one of the key measures of success for the initiative.
During the workshop, Andrea and Bill both put their analytic powers to use and come up with some initial calculations, which they present independently to the project lead, whose response is “These two numbers are so far off, we can’t trust either one of them.” The workshop is then re-purposed to define the proper way to calculate ad revenue, and finalizing the project charter is delayed to the following week. When you have a variety of people – all with different skill sets, data literacy, and business focus – creating analytic content, how do you ensure that they are all using the same data sources, definitions, calculations, and methods when trying to solve similar business problems?
Maintaining assets like data catalogs and definitions for standard enterprise terms is one factor in the solution, but defining a process for sanctioning content and ensuring that there is a high level of awareness around how to access and use those data catalogs and definitions is of critical importance for ensuring accuracy and consistency.
The Data & Analytics ecosystem is rapidly evolving. We are at the point today where the generation, acquisition, storage, and analysis of data to inspire business insight and action is well beyond Data Warehouse tables with rows and columns and centralized teams producing reports for the rest of the business.
Organizations once strived to undertake “Big Data” efforts as standalone projects or programs, but these are now considered a typical component of a comprehensive Data & Analytics strategy, and “Big Data” is in effect, just “Data.” Similarly, efforts to enable “Self-Service” Analytics should not be considered separate initiatives and should be reflected in the overall Data & Analytics strategy as well, as the enablement of effective, modern, Analytics (no prefix needed).
If you enjoyed this article and want to read more written by Crystal Meyers, view her collection.

References
- “The Four V’s of Big Data.” IBM Big Data & Analytics Hub, www.ibmbigdatahub.com/infographic/four-vs-big-data.
- “Gartner Says Self-Service Analytics and BI Users Will Produce More Analysis Than Data Scientists Will by 2019.” Gartner IT Glossary, Gartner, Inc., www.gartner.com/en/newsroom/press-releases/2018-01-25-gartner-says-self-service-analytics-and-bi-users-will-produce-more-analysis-than-data-scientists-will-by-2019.
About Ironside
Ironside was founded in 1999 as an enterprise data and analytics solution provider and system integrator. Our clients hire us to acquire, enrich and measure their data so they can make smarter, better decisions about their business. No matter your industry or specific business challenges, Ironside has the experience, perspective and agility to help transform your analytic environment.

