Navigating Tableau Conference 2016: An Interview with Crystal Meyers and Katelyn Tolbert

We’re getting ready for Tableau Conference 2016 here at Ironside. With only a short time left until November 7th, our team is preparing for which parts of the conference they’re most excited to take in. And, more importantly, developing strategies for prioritizing where to spend their time. I got a chance to catch up quick with Crystal Meyers and Katelyn Tolbert, two of our Tableau-certified consultants, to hear what they’re looking forward to and get their perspectives on where people should be focusing at the conference.
Keen Hahn: Crystal, Katelyn, thanks very much for taking the time to talk with me today. I know you’ve been digging into the Tableau Conference 2016 session options lately and they’re very extensive. How do you think attendees should go about picking from the sessions available during the conference? Are there any priorities they should consider more than others?
Katelyn Tolbert: Well, what do I do when there are more than 20 sessions happening simultaneously to choose from ? Honestly though, I think that instead of feeling overwhelmed with all your options for talks to attend, you should take a deep breath and get excited that there are so many fantastic resources about to be right at your fingertips. Note that there are different tracks available. If you are a report developer for example, you may find that the developer, analytics, and dashboard & design tracks contain content of most interest to you.
I recommend making a list of your top 3 choices for each of the time slots. Anyone who has been to a larger tech conference before knows that some talks end up being more popular than others and may fill up quickly. It’s always smart to have a backup plan. If you notice a few sessions on the list that you consider to be critical must-sees, I recommend arriving early to the room to ensure you get a spot.
Another helpful tip to decide what to attend is that, if you’re torn between sessions, research the presenters! While I’m sure that Tableau is only bringing in the best and brightest minds, it’s definitely true that an awesome presenter makes all the difference. Typically speakers will have done this before and you can often find YouTube clips of their speaking style online. Choose the presenter whose presentation style you find to be most engaging. Also note that many of the sessions are repeated so if you miss them the first time around don’t lose hope.
Crystal Meyers: Also, Tableau just released their Mobile App for the 2016 Conference, which has a schedule of all of the sessions and allows attendees to search by day, experience level, track, and type. Many attendees come to the conference with specific challenges and use cases in mind that they would like to focus on, and this is a great way to search for sessions that can address those things. I would also encourage attendees to choose at least one session that is a bit outside of their comfort zone (for example, if they are on the technical side, attend a more business focused session and vice versa). This will help them gain valuable insight into how other areas use and/or manage Tableau and see the value and potential challenges of the platform from another perspective.
KH: That seems like a good strategy. With so much going on, it’s important to maximize the impact of the sessions you do spend your time on. I’m sure that applies to specific functionality focal points in addition to speakers. Are there any specific Tableau use cases you think will be most useful to investigate?
CM: Tableau, and tools like Tableau, have disrupted the BI market, transforming how organizations tackle data discovery and self-service analytics. This is evident in Gartner’s transition of the Magic Quadrant for BI Vendors in 2016. It is no longer sufficient to have only an operational reporting (Mode 1) tool. Some of the sessions that I see being the most useful at Tableau Conference are those that address the bi-modality of analytics and the implementation of a BI roadmap that addresses both Mode 1 and Mode 2 needs and incorporates and path to operationalizing Mode 2 solutions to Mode 1 when they cross the threshold.
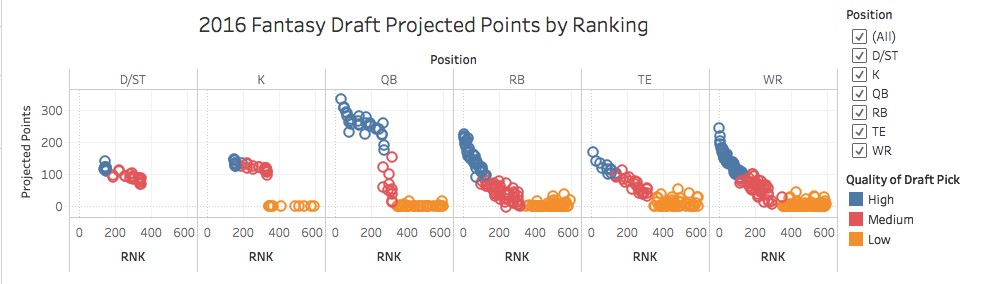
KT: As I’ve stated in my article The Newbie Data Science Guide, I really believe that there is a lot of value to be realized by organizational investment into predictive and prescriptive analytics. Tableau is especially well geared towards creating unbelievable dashboards with interactive visualizations that can not only explain to users what is happening right now in their business, but can also alert them to potential issues in the future.
I also recommend making an effort to seek out a talk or two on how Tableau can get you away from outdated PDF reporting and reap the benefits of live, on the fly, agile analytics. And if you’re new to Tableau, definitely check out the basic tutorials! You’d be amazed at your ability to get up and running with the software in just a few brief sessions.
KH: Speaking of the software itself, are there any specific pieces of Tableau 10 functionality you feel attendees should definitely investigate?
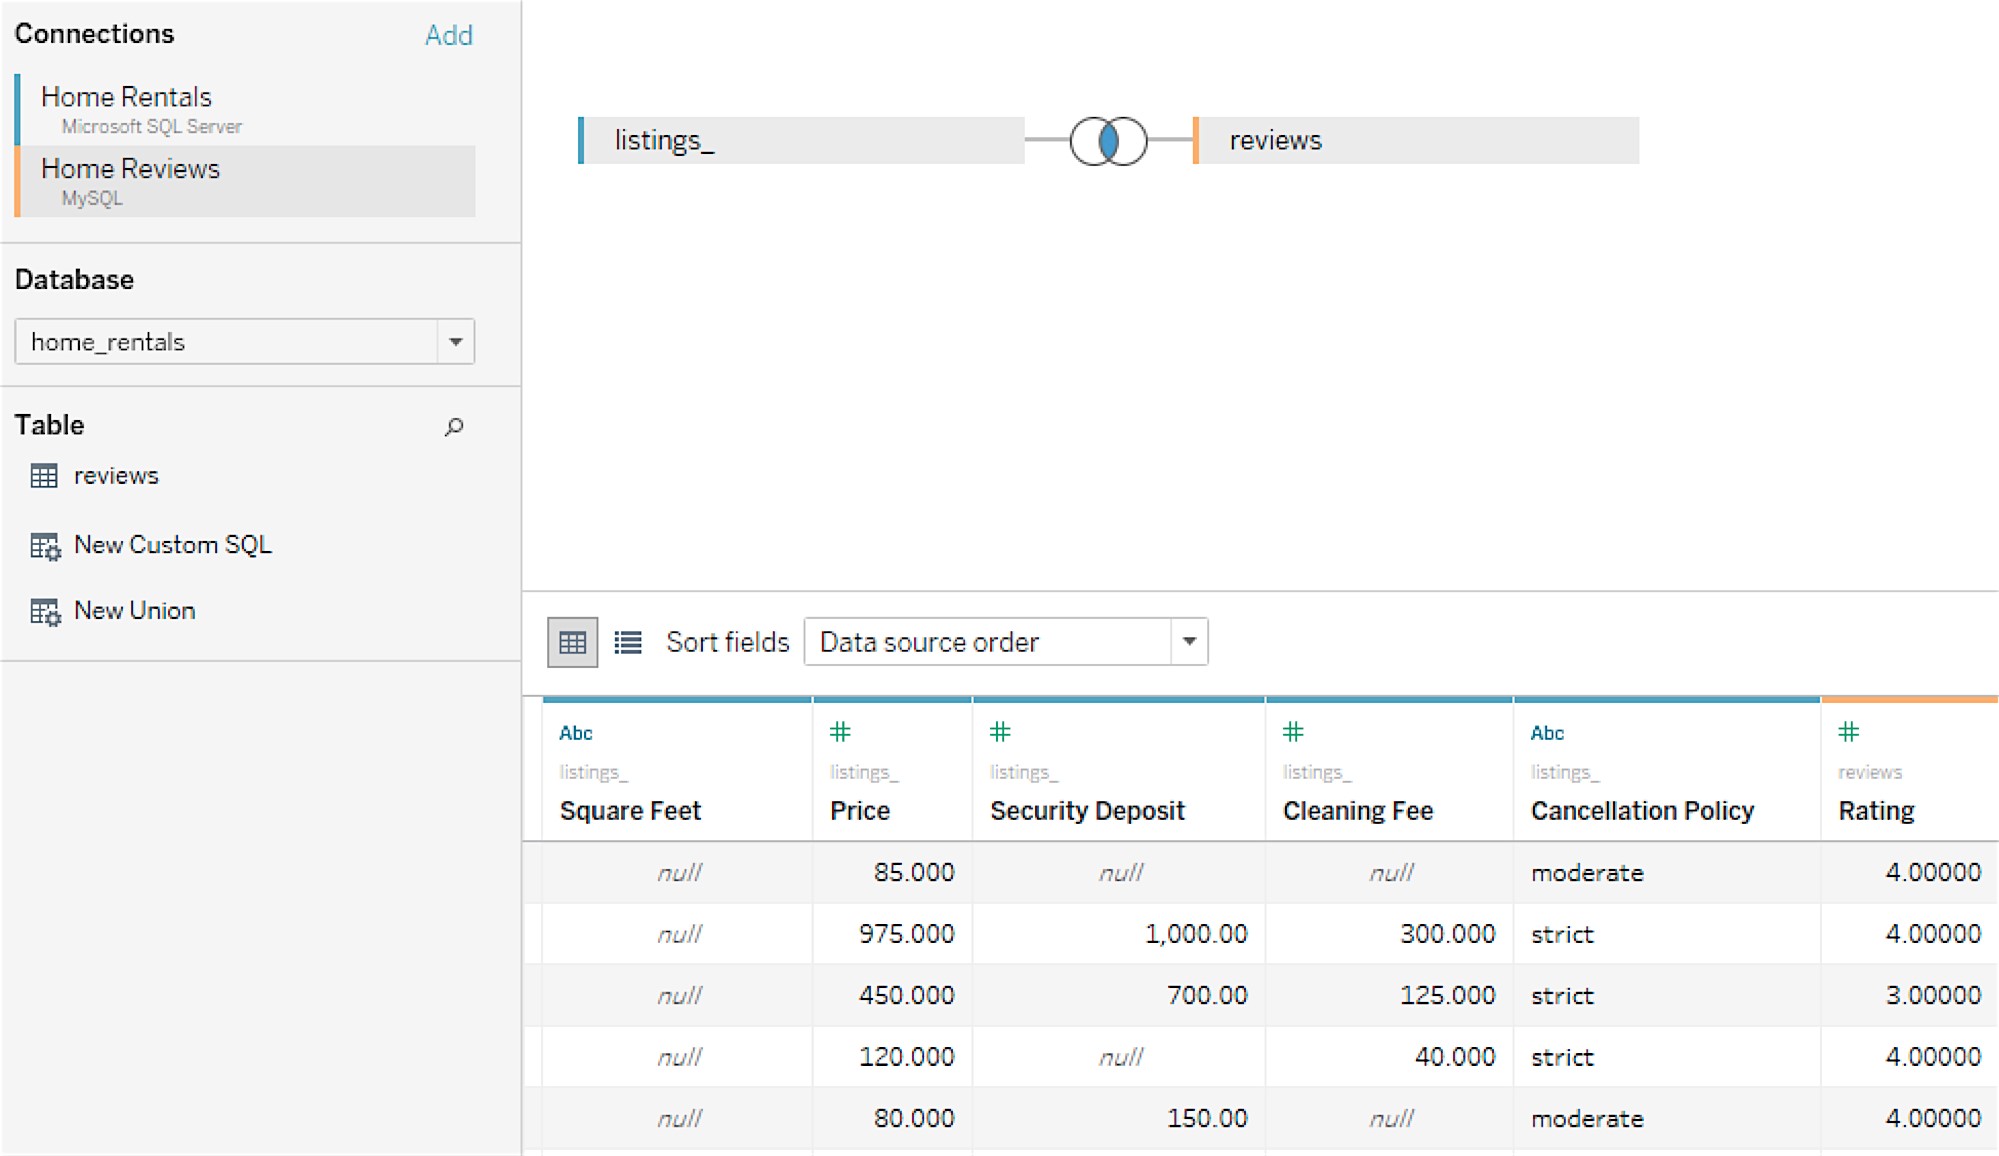
KT: If you have not yet used Tableau 10 (and missed the Ironside demo!) you should definitely make it a point to attend a session that goes through cross-database joins. This is a huge advancement in terms of bringing together data from multiple sources. It would also be quite valuable to learn about how to use the clustering analysis feature as well as the more technical details behind the algorithm in the background.
CM: I agree that one of the most interesting new releases of Tableau 10 is the ability to perform cross-database joins. There are several sessions offered at the Conference around this new capability and I think it is important for attendees to understand how this functionality works and when it should be used over data blending (or perhaps when data blending may be preferred).
KH: I’m sure with the amount of advances this new release has made there will be a lot of people wanting to get Tableau certified. Since you both have done it, what do you recommend attendees do to prepare if they plan on taking a certification exam?
CM: The Exam Preparation guides on the Tableau website are incredibly valuable, and I would recommend going through these several times before sitting for either a Qualification or Certification Exam. The more practice you can get the better.
KT: Definitely! Make sure to prepare ahead of time! A good rule of thumb is that if you can complete Tableau’s practice exam with your notes closed in under an hour then you are likely well-positioned to succeed. It’s important to be very familiar with the tool and how to perform calculations. Spend some time each day leading up to the exam reviewing concepts, practicing problems, and even playing with data sets on your own to discover interesting insights. Remember that “groups” and “sets” are both very useful on the exam, but they have different use cases.
KH: So turning back to you and the Tableau Conference 2016 agenda, do you have any specific sessions or activities you’re particularly looking forward to?
CM: There are several partner enablement sessions that I am personally looking forward to, since our partnership with Tableau is in the earlier stages and it will give us more insight into how we can appropriately work together with Tableau to meet our clients’ needs.
KT: I am personally a data science nerd and am particularly thrilled to attend the “Accelerate Your Advanced Analytics” talk to learn more about how Tableau integrates with R and Python. I will also likely be seeking out other sessions pertaining to predictive analytics and mastering big data applications with Tableau.
I am also particularly excited for the spur of the moment conversations that occur in between sessions or at the Meetups. Don’t be afraid to network. It’s amazing what you can learn about Tableau, or technology in general just by striking up conversations with those around you. It may lead you to a solution for a problem you are having within your own work, or perhaps inspire you to tackle an issue you didn’t even realize you had!
KH: As a final question, I’d like to talk a bit about conference philosophy in general when it comes to specific technologies versus broader concepts. What’s the value of going to a conference put on by a specific vendor as opposed to a more general conference like Gartner? Are there any effective ways to still make comparisons while at a vendor-specific event?
KT: Networking and learning from real live use cases is always a good use of your time regardless of the context, especially if you are interested in a specific industry or company. Use this time to your advantage.
While you should be prepared for a pitch at a vendor-specific conference on why whoever the host company is is pretty awesome, you should also expect to see some really valuable examples of how their technology is used to solve problems that will likely transfer into your own industry or corporation in some way. Tableau Conference 2016 is no different in this regard. You can really dive deep into the tool and how it’s used.
Something else Crystal mentioned earlier that’s helpful when it comes to getting through all the sessions is the Tableau Conference app. It allows you to check off multiple sessions per hour, so after you take a first pass through note how you can re-arrange your schedule to maximize the interesting content you get to see.
CM: To me, the value of a technology specific conference is that you can customize the level of detail that you wish to be exposed to, from high-level use cases or best practices all the way down to technical solutions for specific challenges. There are experts available that know the technology that you are working with and how it integrates and works with other technologies or processes that you may have in place.
Many of the sessions offered are actually geared more toward visual analytics, self-service analytics, or enterprise business intelligence best practices in general, and although they may be based on how Tableau specifically fits into these practices, the concepts and lessons presented are technology independent and will be useful to you regardless of your chosen analytics system.
KH: Thanks for all your answers, Katelyn and Crystal. It’s been great talking Tableau with you.
KT: Thanks for having me. I hope this interview helps people get as excited about Tableau Conference 2016 as I am.
CM: It’s been a pleasure. Looking forward to the conference.
Next Steps
If you’d like to dig deeper into Tableau, Ironside can help. We’re a Tableau Partner and have a variety of resources available for you to explore. Take a look at this other Tableau-related content for further insights:
- Top New Features in Tableau 10
- Ironside and Tableau Partner to Power Data Discovery
- Empowering Insight with Tableau: A Case for Self-Service Analytics

Crystal is a BI Engagement Manager who has over 8 years of experience working in a range of business intelligence and data management roles and is one of Ironside’s prominent thought leaders. Her wide breadth of knowledge and strong ability to develop solutions that fit strategic and long term goals without compromising immediate business needs, timelines, and budgets has made her invaluable to the many clients she’s served. Beyond her daily engagement work, Crystal also constantly seeks to uncover the latest advancements in analytics, and is a respected contributor of articles to both Ironside’s website and independent industry publications. Her specialties include self-service BI, data governance, location intelligence, metadata modeling, and report development.

Katelyn is a Business Analytics Technical Consultant working in the Ironside Solution Center. Prior to joining the Ironside team, she worked as a Chemical Process Engineer for almost two years at Dow Chemical. After discovering a love for analytics, she pursued her Master’s of Science in Business Analytics with a focus in Data Science from Bentley University Graduate School of Business. Katelyn is passionate about using data to gain a deep understanding of business processes, predict future outcomes, and optimize decision making. Her specialties include predictive modeling, optimization/decision science, experimental design, and report development.
About Ironside
Founded in 1999, Ironside is an enterprise data & analytics solution provider and system integrator. From strategy to execution, we help organizations translate business goals and challenges to technology solutions that enable business insight, analysis, and data-driven decision making. Our core capabilities include Business Analytics Strategy, Business Analysis & KPI Modeling, Enterprise Planning, Data Science & Machine Learning, Data Integration & Governance, UX Design and Data Visualization.