3 Ways to Modernize Your Cognos Environment

The last several years have represented an interesting journey for organizations and teams leveraging Cognos for analytics. During that time, visual data discovery tools have made a significant impact. However, as of late, we have seen the pendulum swing back to concepts introduced by enterprise BI tools long ago.¹ What’s old is new again.
When these new tools arrived, they challenged both the status quo and what many of us saw as an ideal solution to the localized, ungoverned, manually-intensive, and often error-prone data manipulation (i.e. “shadow analytics”) processes of the past. If we think back to the dawn of the modern business intelligence age in the mid 1990’s, we realize that these challenges are what tools like Cognos were developed to solve.
The dazzling and attractive visualizations, promised ease of use, and “business empowerment” mantra of these new tools shone brightly, casting a long shadow upon the more traditional, IT-centric analytics tools like Cognos, to the point where many users began to look upon these solutions not as powerful analytics tools but as technical debt.
IBM was perceived to be late in recognizing the shift in the marketplace and their initial efforts to capture this “Mode 2” opportunity lacked refinement and broad appeal.

Concepts like intuitive, governed, and secured metadata models and multi-dimensional OLAP cubes that required deliberate investment to design began to be perceived as roadblocks to business value and content development “took too long.”
However, we have observed a shift in the marketplace. Gartner forecasts that while the majority of business users had access to self-service reporting and data-preparation tools by the end of 2017, less than 10% of them would be governed sufficiently to prevent negative business outcomes.² Nucleus Research has reported that many organizations, having chosen to switch analytics vendors, found the ROI of their new solutions delayed upon the realization that their data was “unruly” and in need of “extensive data preparation” before they could successfully deploy.³ From our perspective, it is not uncommon to hear stories from clients about how new tools have caused disruption, confusion and a higher TCO for analytics.
Ironside’s perspective is and has always been that while tool choice is important, more critical is how you implement it and the processes you put in place to enable users and support adoption. In addition, ensuring that data is understandable and trusted is critical for analytics success. We also understand that many organizations underestimate both the obvious and hidden costs of a “rip and replace” approach to what is a core business system.
So, what can a legacy Cognos customer do to harvest the investments made in enterprise BI solutions while addressing the promised “business empowerment” of the newer-to-market data discovery tools?
We suggest three ways of accomplishing this.
The 3 Ways – Embrace, Enable and Enhance
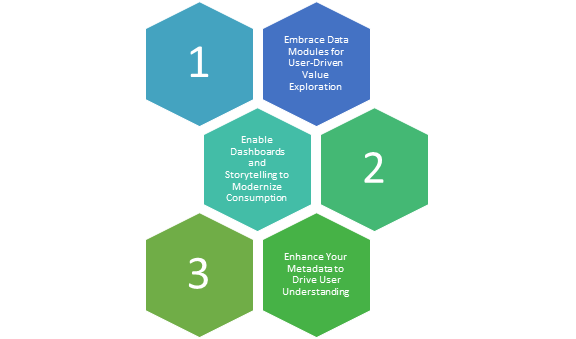
1. Embrace Data Modules for User-Driven Value Exploration
Data Modules were introduced in Cognos Analytics and allow permissioned users to ingest and combine data sources (including your legacy Framework Manager metadata), “wrangle”, filter, and cleanse that data and expose it through reports and dashboards. New releases of Cognos Analytics have delivered enhancements to this core capability including the creation of calculations, data groups (e.g. age ranges based on an age column) and hierarchies. When considering enabling this functionality for your users, be sure to have a plan for doing so as preparation and “rules-of-engagement” are critically important to avoid spawning “shadow analytics” (again).
2. Enable Dashboards and Storytelling to Modernize Consumption
Ironside believes that user adoption is one of the most important aspects of any analytics implementation. Critical to that adoption is the provision of tools and capabilities that are aligned with user needs and skills. We believe that the level of functionality available in Cognos Analytics Dashboarding is well-aligned with the needs and limited training opportunities of the typical time-crunched business analytics user. These users simply want to quickly and easily create a visual interface to help them understand the current state of those data points they leverage to make everyday decisions (without having to invest significant time in training).
Learning how to create compelling dashboards in Cognos (including mobile authoring) can be accomplished in minutes instead of hours and days, allowing your time-challenged users to spin up mobile and desktop-accessible interfaces that allow them to focus on what’s important and help them meet their goals. The Stories functionality takes this approach and focuses it on delivering insights to a more pure consumer persona, reducing much of the effort necessary to take visual and tabular analytics content and bake it into more traditional presentation applications.
3. Enhance Your Metadata to Drive User Understanding (and possibly Performance)
Framework Manager is an incredibly powerful tool. Unfortunately, many organizations just scratch the surface of its capabilities, deploying models that are, at worst, mirror images of complex source databases. They fail to consider business use cases when developing models (let’s just bring in ALL the fields!) or don’t fully embrace the data governance feature set (e.g. leverage the business glossary functionality and link it to a wiki or data dictionary, using data lineage, creating descriptions and tool tips, etc.) to make the process of self-service authoring easier for users. If we fail to make the process of content creation intuitive, adoption will suffer and users will seek alternatives.
How Can You Get Started?
Begin to explore the ideas above to offer more modern capabilities to the analytic personas who might benefit from them. This article is the first of several to focus on these issues, with more to come soon. If you want to get started and find you need help, let’s talk.
References
1 “Forrester Reshuffles the Deck on BI and Analytics Tools.” Datanami, 15 Sept. 2017, www.datanami.com/2017/09/15/forrester-reshuffles-deck-bi-analytics-tools/.
2 “Magic Quadrant for Business Intelligence and Analytics Platforms.” Hype Cycle Research Methodology | Gartner Inc., Gartner, Inc., 23 Feb. 2015, www.gartner.com/doc/2989518/magic-quadrant-business-intelligence-analytics.
3 “Analytics Technology Value Matrix 2017.” Nucleus Research | Return On Investment (ROI), Oct. 2017, nucleusresearch.com/research/single/analytics-technology-value-matrix-2017/.
About Ironside
Ironside was founded in 1999 as an enterprise data and analytics solution provider and system integrator. Our clients hire us to acquire, enrich and measure their data so they can make smarter, better decisions about their business. No matter your industry or specific business challenges, Ironside has the experience, perspective and agility to help transform your analytic environment.

