

Highlighting Every Other Row in a Report Using IBM Cognos Workspace Advanced with a Twist
For an updated version of this blog post using IBM Cognos Analytics 11.1.7, click here.
For users of IBM Cognos Workspace Advanced (formerly Business Insight Advanced), a popular request is to have the ability to highlight every other row in a list report. This technique has been demonstrated with IBM Cognos Report Studio using the running-count() and mod() functions. The issue is that IBM Cognos Workspace Advanced does not expose all functions that can be used in query calculations, so users think they are not available.
This article will demonstrate how to highlight every other row using IBM Cognos Workspace Advanced by entering a ‘non-exposed’ function in the expression editor (the twist!).
In order to create the report, the following objects will be used:
– List container
– Running-count() function (not-exposed)
– Mod() function (exposed)
– List Columns Body Style ancestry
– Conditional Styles
– Query calculations
Create the query calculation
For this exercise, a query calculation will be created to display the numbers 0 or 1 on every other row. If the row has the number 1 on it, it will be filled with color. To accomplish this, the running-count() function will be used to get a sequential list of numbers. The mod() function will be used to divide the running count results by 2, which will result in calculations with a remainder of 0 or 1.
1. Create a simple list report.
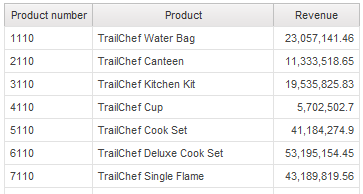
2. From the Toolbox, drag a Query Calculation to the list report and name it Count and click OK.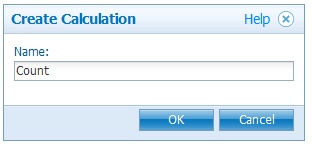 3. Select the Functions folders. The first function we want to use is running-count.
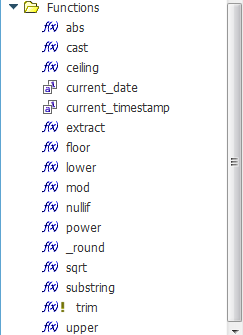
Note: It is not available for selection, however, the ‘twist’ is that it can be manually entered (this requires some knowledge of common and database related specific functions). Out of sight does not mean out of mind!
4. In the Expression Definition, enter running-count(). Since Revenue appears on each one, it is a good candidate to count.
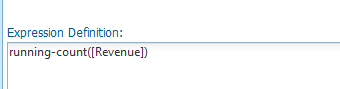
You should drag the revenue column to the expression from the Data Items tab. Click OK.
5. The results of the running-count() function show sequential numbers.
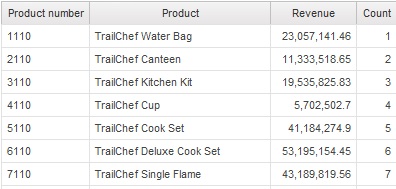
Now the mod() function should be added around the expression to generate the remainder numbers 0 or 1.
6. Highlight the Count column title and right-click to expose the sub menu. Select Edit Query Expression.
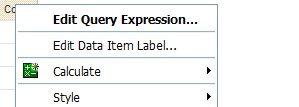
7. Modify the expression as follows:
mod(running-count("); copyLinks.forEach(function(link) { if (link.hasAttribute("data-listener-added")) return; link.setAttribute("data-listener-added", "true"); link.addEventListener("click", function(e) { e.preventDefault(); var tempInput = document.createElement("input"); tempInput.value = window.location.href; document.body.appendChild(tempInput); tempInput.select(); document.execCommand("copy"); document.body.removeChild(tempInput); var originalText = this.querySelector(".social-sharing-icon-label")?.textContent || ""; var originalTitle = this.getAttribute("title"); var originalIcon = this.querySelector("svg").outerHTML; // Show success feedback this.setAttribute("title", "Copied!"); this.classList.add("copied"); if (this.querySelector(".social-sharing-icon-label")) { this.querySelector(".social-sharing-icon-label").textContent = "Copied!"; } else { this.querySelector("svg").outerHTML = ''; } var self = this; setTimeout(function() { self.setAttribute("title", originalTitle); self.classList.remove("copied"); if (self.querySelector(".social-sharing-icon-label")) { self.querySelector(".social-sharing-icon-label").textContent = originalText; } else { self.querySelector("svg").outerHTML = originalIcon; } }, 2000); }); }); });