Highlight Alternating Rows in a Report Using IBM Cognos Analytics (11.1.7)

For users of IBM Cognos Analytics a popular request is to highlight alternating rows in a report. This article will demonstrate how to achieve this result using the list container and the property Conditional Styles.
In order to create the report, the following objects will be used:
| Object | Definition |
| List container | Contains report data |
| Query Calculations | Create calculations |
| Running-count() function | Get sequential numbers |
| Mod() function | Get remainders of 0 or 1 |
| List columns body style ancestor | Ancestor object used to highlight the data |
| Conditional styles | Create type of style |
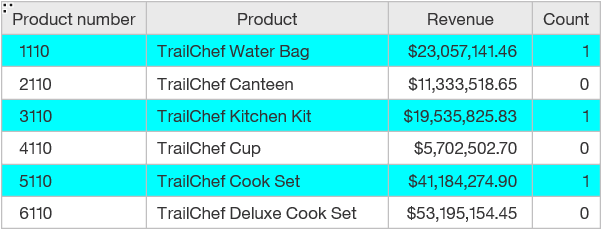
Finished Product
When the demo is finished your report will look similar to the following:
Let’s get started. The first thing we’ll do is create a simple list report using the sample GO Sales (query) package included with the application. However, you can use any data to follow along.
Create the query calculation
- Select the blank template and create a report using the List container.
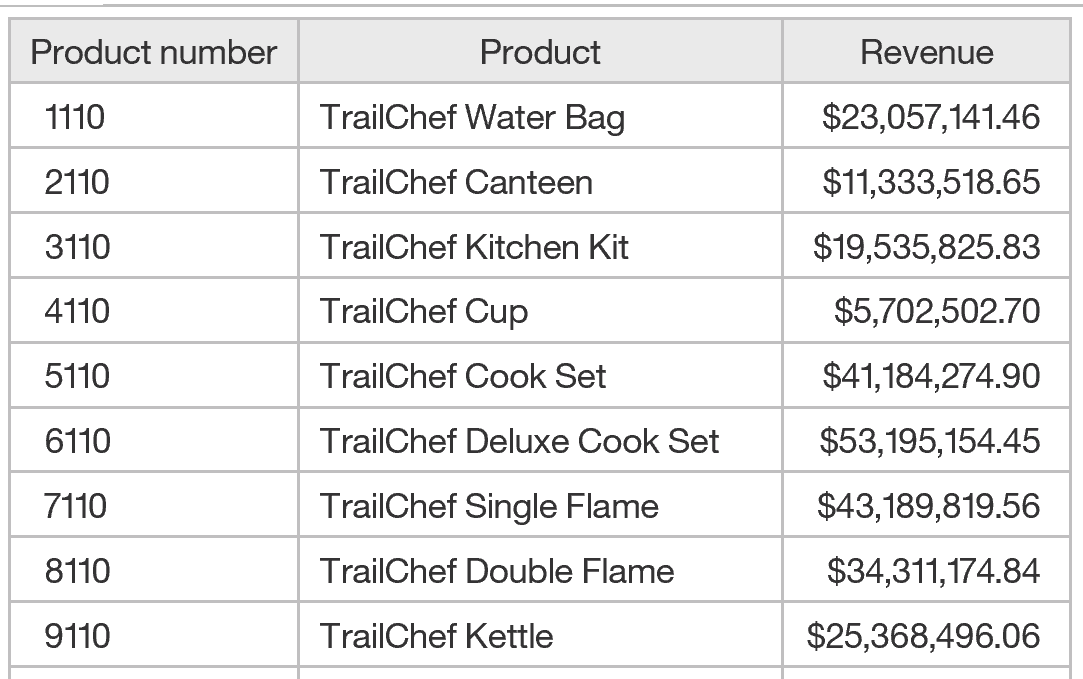
- From the Sales(query) namespace add the Product number, Product and Revenue data items to the list.
 |  |
- View the report in Page Preview.
 |  |
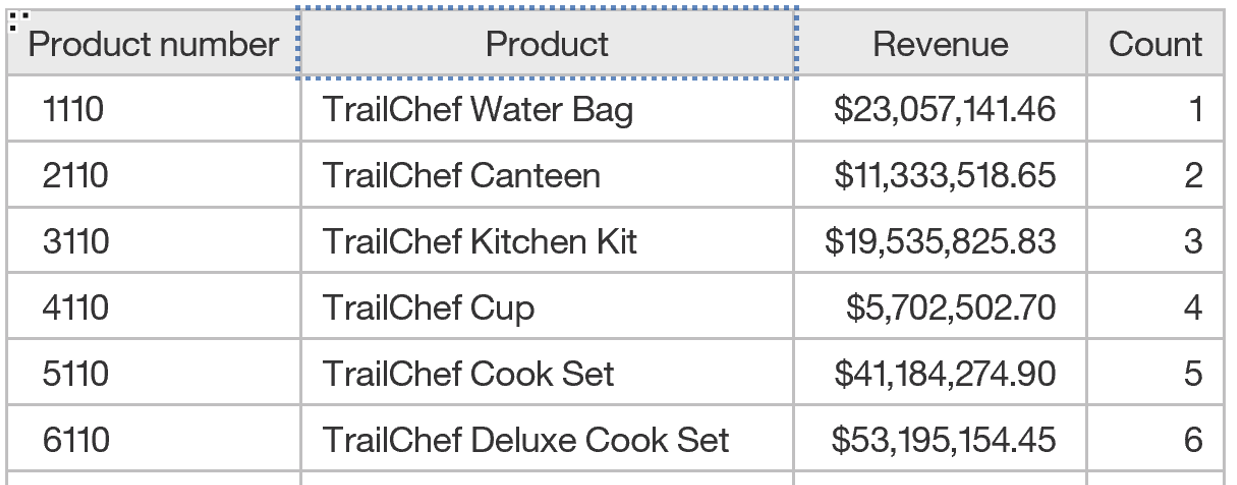
- From the Toolbox, add a Query Calculation to the end of the list container next to Revenue. The Data item expression dialog will open. Name the calculation Count.
- Click the Functions tab at the bottom of the screen.

- Open the Summaries folder and double click the running-count() function to add it to the expression. This function returns the running count by row for a set of values.

- Click the second tab on the dialog box, Data Items
, and drag the Product Number to the function. Add the ending parenthesis.
Running-count(Product number)
- Click OK to view the results.
The result of the running-count() function will show sequential numbers on each row.
Create Values to Highlight
The mod() function returns the remainder of two numbers. In our case it will generate the numbers 0 or 1 after the division takes place.
We will nest the mod() function around the running-count() function to achieve this result.
- Double-click the Count column title to return to the Data item expression.
- Modify the expression as follows.
mod(running-count([Product number),2)
- Click OK when done to view the report. Note the position of the parentheses and the divisor is 2. Even numbers will have a remainder of 0 and odd 1.
Note: the mod()function is available for selection, however, we are typing the expression to ensure the correct syntax is applied.

The results of the calculation show 0 and 1 on alternating rows.

Apply Conditional Formatting
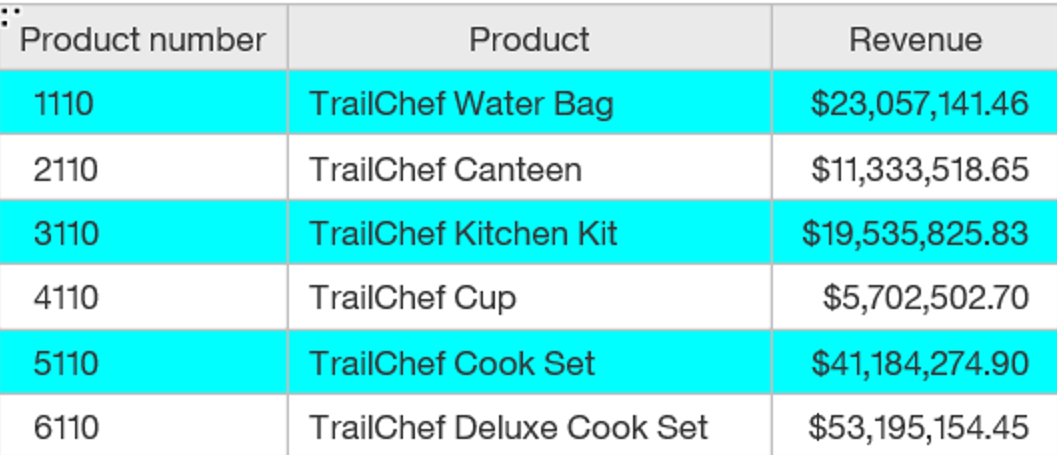
We will now highlight the rows in the list object using the List Columns Body Style ancestor. A row with the value of 1 will be colored.
- Click any column in the List container and at the top of the Properties pane or on the flyout menu select the ancestor object and click List Columns Body Style. When selected the area will highlight in the list.
 |  |
2. From the Properties pane double click the Conditional Styles property. The Conditional Styles dialog box will appear. Click the plus sign (+) and select New Conditional style > Count. Click OK.
 |  |
- Click the plus sign (+) to add a threshold value of 0 and click OK. In the Style column click the first edit button (pencil) and select a Background color. Click OK. Note the arrow next to the 0 is pointing upward indicating the color will generate for values greater than 0. Click OK to exit all dialog boxes.

- View the report.

5. Since the Count column is not needed in the report remove it using the Cut button (scissors). Do not delete the column as it is used in the calculation used to render the conditional formatting and must remain in the underlying query.
As you can see, alternating row colors in a list report is simple in IBM Cognos Analytics!
Happy reporting!
For the original version of this blog post using IBM Cognos Workspace Advanced, click here.
