Analytics Anarchy: How To Manage a Multi-Vendor Analytics Ecosystem

When you think about the different ways that data gets used in your company, what comes to mind?
You surely have some executive dashboards, and some quarterly reports. There might be a reporting portal containing everything that IT created for anyone within the past decade.
The world of Mode 2 Analytics is a bit different; one team does their own thing in Tableau, another uses Power BI, and a third uses Qlik. Throw in all the data that lives in Excel on laptops, and we can see that this ecosystem is diverse, complex, and massive.
Left alone, an analytics ecosystem will drift towards chaos. You will end up with conflicting definitions for KPIs, untrustworthy data, and the need to support a plethora of Analytics tools – including tools that you didn’t know you had. Today, it’s rare that a company can enforce the use of a single analytics vendor, and keep all the data well-governed. How can we manage all the moving pieces in a modern ecosystem without destroying our ROI?
“We can no longer ask for everything to be done centrally. The world doesn’t work that way anymore.”
– John Fehlner, Engagement Manager at Ironside
A sprawling, multi-vendor ecosystem isn’t always problematic, but it does set up perfect conditions for issues to occur. In order to shape up a chaotic analytics ecosystem (or prevent one from forming), let’s take a look at the different issues surrounding the ecosystem, one at a time.
The Changing Landscape of Analytics
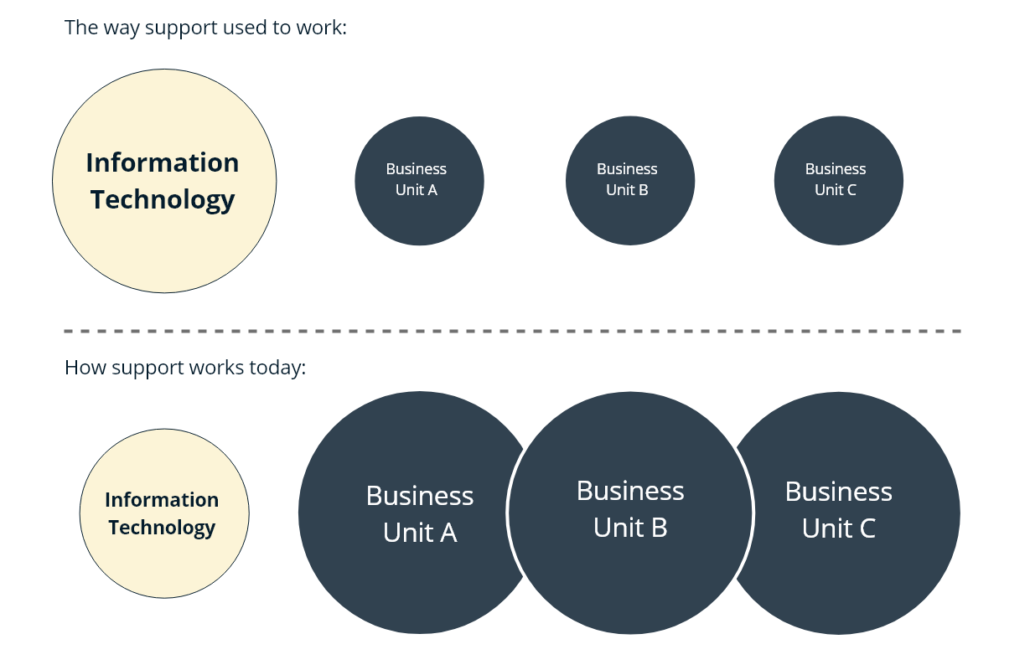
Let’s start with the analytics layer, where the data is ultimately used. This is the part of the ecosystem where most users live. Often, when people think about analytics, what they really mean are the tools that enable you to visualize your data and build analysis on nice dashboards. The analytics layer is also where we see the largest variety of tools and significant investment from individual business units.
It’s now easier than ever to get started with a visual analytics tool on your own; just download one, point to an Excel file, choose a chart type, and there you go. But once a team is committed to a tool, we will start to see the need for additional support. It’s easy for an individual to start, but takes a lot of work and tool knowledge to initially get a whole team set up and running.
After that, the team will need ongoing support in troubleshooting and building comprehensive enterprise applications. Traditionally, the tool experts worked in IT, but we are seeing more of them embedded into the business, and according to Gartner, this trend is likely to accelerate.
“By 2020, the number of data and analytics experts in business units will grow at three times the rate of experts in IT departments, which will force companies to rethink their organizational models and skill sets.”
– Gartner 2019 Magic Quadrant1
Is it a problem for each team to use their own Visual Analytics tool? It depends on a few things:
- How much external support each team needs
- The total cost of licensing and maintaining different tools
- How well we can manage information and content across the organization
What It Really Means to Support an Analytics Tool
First, we need to consider the level (and total cost) of support we need. As my colleague John Fehlner says, “the question is, what does support mean? If we mean tool support, business units are becoming more sophisticated in this realm, and have knowledge workers that 10-15 years ago they wouldn’t have had.”
He goes on, adding, “but sometimes you do pull in extra help, which is where IT comes in. IT might be able to interface with the vendor, or support doing more complex things – and this is where the bottleneck is.” And importantly, no IT team can truly support all the tools that business units will want to use, so a company will always want to limit official support down to a few, broadly used tools.
Data & Content Management are Critical
In most cases, the primary source of pain in an Analytics Ecosystem is governance and process, rather than tools. Of course, the source of our solution resides here as well.
The data management layer is the heart of this ecosystem – literally. It’s where we input all source data and distribute it to the rest of the system. If we manage this layer well, it enables us to have flexibility in the Analytics layer. A good data management process helps an organization tolerate a variety of tools in the Analytics layer. A content management strategy is also important to ensure that users understand where to go for trusted analytics content or are enabled with tools that can guide them appropriately.
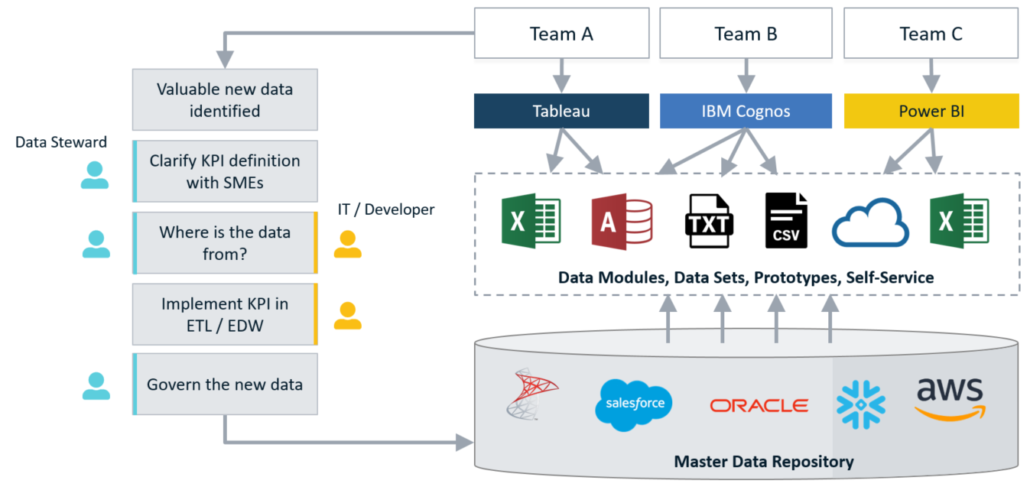
In addition to support, we need to think about consistency with the broader organization, regarding data, terminology, and branding and design patterns. Having different tools across the organization tends to help strengthen data silos, misses the advantages that come with knowledge sharing, and most likely means a lot of duplicated effort. To tackle this particular form of dysfunction, it would help immensely to create a formal data steward role in your company.
In a perfect world, you can plug governed company data into any analytics tool, and there would be no issue with data quality and meaning. But in reality, this is not what typically occurs. Business users tend to pull in whatever data they can get their hands on; a lack of shared tools keeps this data hidden and exacerbates the chaos.
It’s important that any operating model for a modern analytics ecosystem include a “data lab” for analysts to explore new sources of data without running into change management friction. Models of this type also enable analysts to identify new sources of value and support their promotion to the enterprise data tier. Providing and enabling a smooth process for analysts to champion new data helps us work against the tendency for tools and business units to devolve into data silos.
When Should We Consolidate Our Analytics Ecosystem?
At some point, you’re going to take stock of the ecosystem and make some big decisions. Do you have too many Analytics tools? When should you decide to migrate teams to a common tool?
“Retiring a tool can sometimes be very expensive. If you’ve used a tool for 10 years, it might take 10 years to migrate.”
– Susan Ma, Technical Manager at Ironside
Some caution is warranted here. What people often don’t realize when they are moving to a new tool or consolidating, is the extent of work that needs to happen behind the scenes. If you have not yet gone through a major BI tool migration, it’s even more complex than you might imagine. You can get started quickly by virtually pulling elements into the new environment, but to truly migrate is a very involved process.

It’s best to think very carefully about migration. You’ll need to gain a deep understanding of the existing usage and conduct a thorough impact analysis. For example, if you’re doing it for the Analytics tool with great visualization features, you might not really need to migrate at all. Consider bulking up your Data Management process, and serving up data views to the tool. A migration is your opportunity to go back to the drawing board and rethink your design, user needs, personas, as well as your technical infrastructure and toolset.
“Migration starts with the data and the structures, before it gets to the tools. You can’t just repoint things – there’s always a project behind it.”
– John Fehlner, Engagement Manager at Ironside
In sum, don’t consolidate the ecosystem without a full understanding of it, and when you do, take advantage of the opportunity to make workflow-driven improvements.
We Can Have An Ecosystem That Works
It is possible to have a multi-vendor ecosystem that works. It requires looking across the organization and choosing tools wisely based on needs and supportability. But above all, it requires a high level of focus on the governance layer. We need to create effective processes, invest in people to manage it, and promote a culture that values accuracy above all. “One KPI, One Definition” needs to be a core value. Let people have their tools, but provide them with governed data, and make sure that they are part of the governance process.
This article was co-authored by John Fehlner and Susan Ma.
Customer Spotlight
Learn how other organizations are tackling analytics anarchy and have achieved success in managing their multi-vendor analytics ecosystems and enabling their users with greater business insights.
A regional bank was experiencing issues with reporting and needed a way to enable users to be more independent of IT and build on their solid enterprise analytics foundation. The solution was to create an easy-to-use, self-service model where users could access multiple analytics resources in one place to increase user adoption and enable consistent reporting across departments.

A health insurance company was in need of a more timely analytics results that didn’t involve users having to manually export and manipulate reports from IT in order to get insights. The solution was to migrate to a bimodal platform that would allow users to get more timely data while still maintaining regular reporting.
A multinational personal care company was struggling to provide complete, accurate and timely insights to stakeholders across functional areas and needed a high performing central data repository that would be open to future integrations and drive self-service analytics in an enterprise-level analytics platform. The solution was an enterprise data warehouse that integrated cross-functional and brand data across the entire region.
References
- “Magic Quadrant for Analytics and Business Intelligence Platforms.” Gartner, Gartner, Inc., 11 Feb. 2019, www.gartner.com/doc/3900992?ref=mrktg-srch.
About Ironside
Ironside was founded in 1999 as an enterprise data and analytics solution provider and system integrator. Our clients hire us to acquire, enrich and measure their data so they can make smarter, better decisions about their business. No matter your industry or specific business challenges, Ironside has the experience, perspective and agility to help transform your analytic environment.

