Defining Factors for a Successful Modern Analytics Strategy

When defining or assessing a Data & Analytics Strategy, Ironside leverages a proven framework of understanding the current state and comparing it to a desirable future state with a focus on six key areas, or pillars.
In a previous article, we described how both Data and Analytics have evolved, through the lens of the terms “Big Data” and “Self-Service Analytics,” and alluded to some of the high level steps and influences in making distributed analytics successful on a large scale. Let’s explore those in more detail along with how these particular facets fit into your larger Data & Analytics strategy in the scope of these pillars.
Strategy
Strategy, in regard to enabling a distributed approach to analytics, is all about examining, and sometimes influencing change in, the corporate culture and ensuring that the processes you define throughout the rest of the strategy align with this.
First and foremost, is it a priority of your organization to be making data-driven decisions and actions? If the messaging and activities of leadership reflect the realization that stakeholders across the organization leveraging data to produce insights is an imperative, it will set the precedent for these efforts.
Second, it is important to contemplate the pace of your business as well as any regulatory considerations that may affect your strategy.
Next, what is your organizational community’s appetite for change and innovation? How likely are you to encounter resistance or hesitation around change or taking more agile approaches?
“I predict the Internet will soon go spectacularly supernova and in 1996 catastrophically collapse.”
– Robert Metcalfe, Founder of 3Com and co-inventor of Ethernet
(Two years later, Metcalfe quite literally ate those words.1)
Having a sense of this upfront will allow you to both craft processes that work for your organizational culture as well as plan for the appropriate level of change management.
Data
Data is the driver of analytic value, and as such, it is your foundation. The methods by which data is acquired, transformed, integrated, automated, and made accessible to those who would leverage it to influence decision making will have an impact on the success of a distributed analytics approach.
Traditional data warehousing, where data is modeled into star schemas and stored as a single source of truth in a centralized repository, requires significant time and effort when introducing a new data source. The turnaround time for modern, distributed analytics is on the scale of hours rather than weeks or months, and traditional data warehousing methods cannot accommodate this, so analysts often find themselves tapping directly into source systems or leveraging extracts and APIs to access new data sets.

These analysts may spend a significant amount of time preparing, or “wrangling” their data before they are actually able to do any analysis, as they are often joining data from multiple systems, working with less than ideal data that they have limited or no documentation for, or otherwise manipulating data in order to ensure it is accurate and appropriate for their use cases.
Self-service data prep tools like Alteryx, Trifacta, and Tableau Prep, provide capabilities to help analysts perform this data wrangling in a more efficient way and allow them to move into their analytics more quickly. These tools provide significant ability to modify, manipulate, and integrate data, which, while being the value proposition for their target users, may be somewhat anxiety inducing for IT-based data architecture, governance, and central reporting teams focused on ensuring data quality and consistency in metric definition.
Enterprise Data Warehouses are still necessary for enterprise reporting and centralized applications, however it is no longer feasible for business analysts and data scientists to wait until new data has been modeled into a warehouse to begin solving for their analytics use cases. The unique challenges introduced by the value and proliferation of modern analytics and data in order to meet the demands of business analysts and enable their analytics, without introducing risk and inconsistency. To address this, we recommend taking a value-based approach to data integration.
Our value-based data integration methodology focuses on a phased approach to identifying new data sets, incorporating them into an organization’s data ecosystem, and allowing users to access and use the data in the most valuable ways.
The objective is to allow access to and the use of new data, in order to determine and benefit from its value, prior to and in parallel with undertaking significant effort to model and integrate the data within corporate data stores – like an Enterprise Data Warehouse – and to facilitate enterprise-wide self-service analytics.
This approach accommodates the use of self-service data prep tools in early phases, and introduces activities like data cataloging early on, but saves more effort intensive tasks, like modeling data into star schemas, for later phases when the value of the data has been proven and use cases are better known.
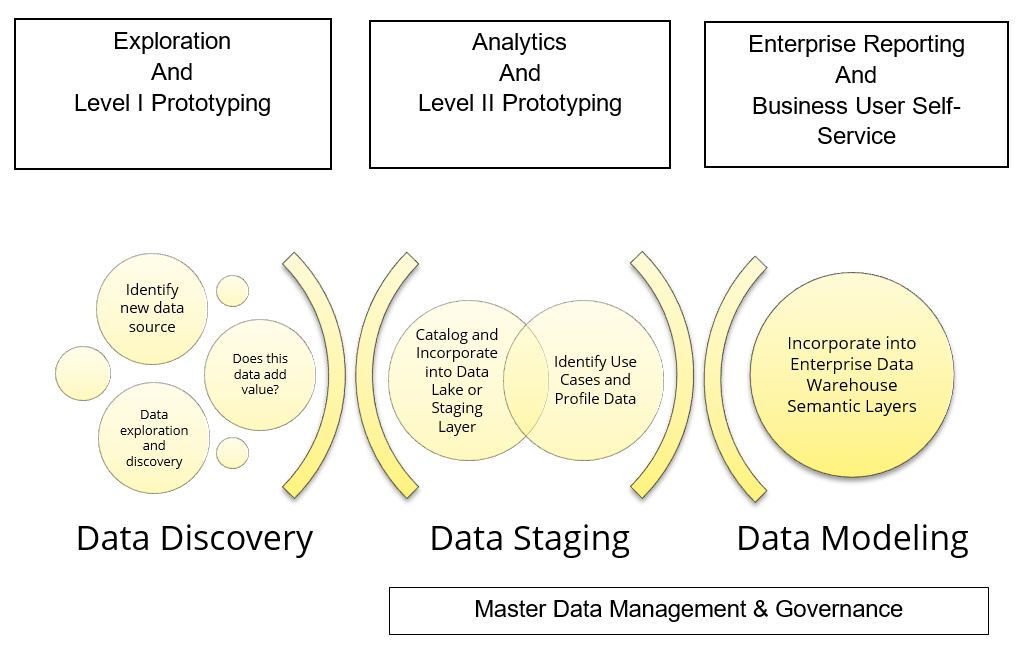
By introducing a phased approach to data integration, enabling access to new data sets for data discovery, use of self-service data preparation and analytics tools for value building prototypes and use case refinement, and incorporating useful data into your organization’s ecosystem at the right time without undue effort, you can help drive your organization’s success with distributed analytics.
Skills & Architecture
When we consider skills, we are not only looking at what people know how to do, but also what they need to be able to do. When it comes to analytics, and particularly empowering business stakeholders to leverage data and analytics to quickly answer their own business questions, one size does not fill all, and we first must seek to understand those stakeholders. Knowing the different personas of users in the analytic community, the common use cases that each will be tackling, the capabilities they will require to be successful, and the level of support they will expect will result in the processes that are defined to enable them to be effective.
Consider this analogy: At the supermarket, you have the option to choose the self-checkout lane or one staffed by a cashier. Many stores also offer different varieties of self-checkout lanes – scan items as you go and just pay at the registers, use a small self-checkout register where you place items in your bag or cart as you scan them, or take advantage of a larger register that allows you to scan all of your items onto a conveyor belt and then bag them up at the end of your transaction. Your choice of lane is based on several factors: how much time do you have, how many items are in your cart, are you tired/hungry/grouchy, is the cashier working the line friendly and efficient?
These same types of factors will affect whether a self-service user creates their own content, or goes to a central team for support, and understanding the factors that will drive this in each of your personas will allow for the right planning and enablement. Once you have an understanding of the capabilities and support that users will desire, the focus turns to enablement. In the vein of the “People, Process, Technology” golden triangle, we recommend focusing enablement activities around “Community, Training, and Tools.”
Tools
We’ve already established that it may not be beneficial to attempt to standardize on a single enterprise analytics platform, however does this mean that business users should have free reign to leverage whatever tools they deem fit for their needs? Not necessarily.
The answer to what and how many tools you should support lies in the results of the effort you took to understand your users. Your analytic tool portfolio should contain the right products to ensure that all of the capabilities and use cases that will be needed can be achieved with the greatest efficiency. Most of the time, this involves a combination of platforms that provide bimodal capabilities, with the particular tool(s) driven by factors such as scalability and flexibility, but most importantly, facilitation of rapid time to insight for business stakeholders. The underlying data architecture and governance processes that you define should be tool agnostic and thus transferable in situations where multiple platforms are in use.
Training
There is a plethora of information available to those seeking to learn how to employ user-focused analytics tools like Tableau and PowerBI. Free and low-cost resources can be easily found on vendor websites, e-learning communities, and even YouTube. It is possible to become an expert in these tools purely through these resources and self-teaching.

However, when we are considering the large communities involved in scaling out a distributed analytic strategy across an organization, it is highly unlikely that everybody involved in that effort will have the time wherewithal to seek out those resources for themselves. In order to ensure a consistent knowledge baseline in those using your analytic tools, it is important to define and support a training plan for your users, tailored to their persona and capability needs. Ideally, this training coordinates with their onboarding and access to the technology, and includes foundational, classroom-based training where they can build a strong base of skills to then build upon using the other types of resources available.
Community
To compliment a well-defined training program, the most useful way to allow the sharing of best practices, methods, tips & tricks, and to allow your business community to not only enable themselves, but to evangelize what they’ve learned to one another, it is important to build a community around the different tools or specific capability needs that exist within your organization.
This can be implemented in different ways, including internal tool-specific user groups, broader Centers of Excellence, or even virtual communities within your internal network. The key is to get people collaborating and sharing ideas across teams and personas to facilitate a continuous flow of knowledge.
Governance
The right data and content governance processes can make or break success with your analytics program in general, but is especially critical when you scale out with a decentralized approach.
Much of governance will focus on data quality and consistency, but when it comes to enabling a self-service methodology, additional attention should be given to two key areas: Awareness and Content Management.
Awareness
Awareness is all about ensuring that analysts and other business stakeholders are “informed of all available data that could benefit an analysis or solve a business problem.” Considering how we introduced the previous article – by describing the changing trends in data volume, variety, velocity, and veracity – maintaining this awareness by acuity alone can prove challenging if not impossible. Data Catalogs can have a commanding impact on increasing data awareness among business stakeholders, by not only providing a central repository for searching available data sets, but also a platform for capturing nuances and important information about these data sets as well as monitoring and measuring usage in order to optimize the value-based data integration approach referenced previously.
Content Management
The proper content certification and content management processes are what help keep the shared environments in your analytics platform from descending into chaos.
First is establishing a strategy around what content can be published or shared, where this will occur, and by whom. You may find it beneficial to maintain separate spaces for user created content with focused value and content that has gone through a sanctioning process and is considered more widely valued or strategic. It is ideal to have this sanctioning or certification process aligned with your data management and integration approach to ensure that content which ends up available for enterprise use is using source data which has been cleansed, modeled, indexed, and automated to avoid issues with staleness or accuracy.
Next is defining a process around usage auditing to identify the content that is most useful and to highlight content that is not being used and can either be retired or re-designed to provide more value. Measuring usage statistics and auditing can be done natively in most BI & Analytics platforms that leverage a server environment for sharing content, and many of these offer methods for creating custom reports using this information so that you can tailor the insights to your specific objectives.
Analytics
Finally, under the Analytics pillar, as everything we’ve discussed thus far is intended to advance analytic maturity and efficiency, we’ll take a specific focus and consider analytics about our analytics program – success measures.
How do you know if you are successful, or where you can continue to improve?
We just mentioned usage statistics and auditing as one way to identify what content is being used, how often, and by whom. In addition to this, it is important to gain more qualitative feedback about not only content, but processes, policies capabilities, and the general business user experience. Surveys, interviews, and other mechanisms can be helpful tools in this regard, particularly when they can be structured in a way that can be quantified and visualized against benchmarks or standards that align with the overall data & analytics strategy.
Below is an example of one such asset that we use at Ironside to help drive our Data & Analytics Maturity Assessment.
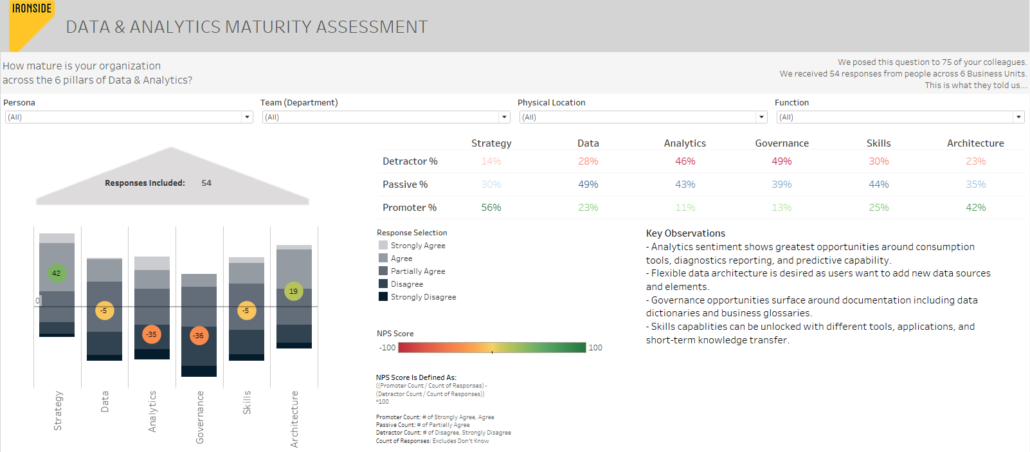
Regardless of the methods, the takeaway is that you do need to define measure for success that align with your data & analytics strategy, and leverage feedback to refine and continuously improve the processes that support this strategy in an iterative manner.
If you’re curious about how your organization benchmarks against peers in your industry with these factors in mind, take the Data & Analytics Maturity Assessment and receive a personalized report to establish the baseline understanding you need to embark on a larger strategic analytics journey.
If you enjoyed this article and want to read more written by Crystal Meyers, view her collection.

References
- Kirsner, Scott. “The Legend of Bob Metcalfe.” Wired, Conde Nast, 5 June 2017, www.wired.com/1998/11/metcalfe/.
About Ironside
Ironside was founded in 1999 as an enterprise data and analytics solution provider and system integrator. Our clients hire us to acquire, enrich and measure their data so they can make smarter, better decisions about their business. No matter your industry or specific business challenges, Ironside has the experience, perspective and agility to help transform your analytic environment.

