Tag Archive for: Report Studio

Difficulty: Medium

Required Ingredients: Two or more crosstabs, Report Studio, report formatting

Scenario:

You have two or more crosstabs on a Report Studio report. All of the crosstabs should have the same report formatting, which differs from the Cognos default. Read more

The popularity of IBM Cognos Active Report has been steadily gaining and as a result, the bar continues to be raised. Active Reports not only offer an incredible wow-factor because of their highly visual and stylized nature, they also offer powerful interactive capabilities that promise to take business analytics to a whole new level. In the past Ironside Group has written about overall Active Report best practices, but let’s assume you’ve already read those articles and still can’t figure out why your reports don’t look as professional as some of the samples you’ve seen. At the Ironside Group, we receive countless requests for assistance in shortening the learning curve to develop pixel perfect Active Reports. This article will walk through some best practices in getting started down the right path, in the hopes of reducing frustrating re-work. Read more

This is the second in a series of articles for the Ironside Cognos Report Studio Cookbook. The first article can be viewed here. These are tips and tricks used by our professional report developers to meet the unique needs and requirements of our clients. While some of these techniques may be touched upon in a typical Report Studio training class, we will take a deep dive into these concepts to uncover how our professionals actually use them in the field every day. Read more

This is the first in a series of articles for the Ironside Cognos Report Studio Cookbook. These are tips and tricks used by our professional report developers to meet the unique needs and requirements of our clients. While some of these techniques may be touched upon in a typical Report Studio training class, we will take a deep dive into these concepts to uncover how our professionals actually use them in the field every day. This month’s article will focus on how to make concise list reports by unlocking the report format. Read more

Portfolio Analysis
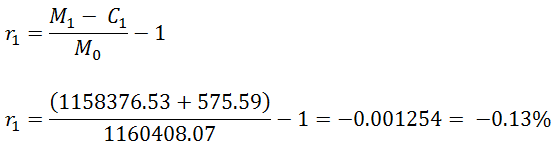
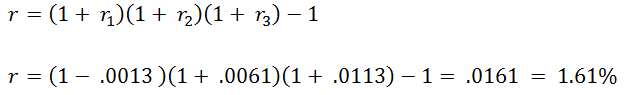
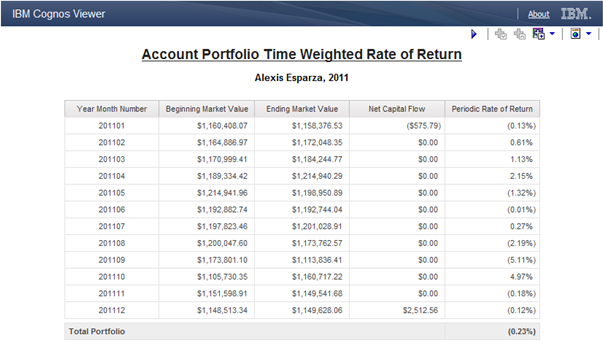
In the investment management or financial services accounting world, one of the most common calculations you encounter in is the time-weighted rate of return (TWROR). The time-weighted rate of return (sometimes called the geometric mean return) is a method of measuring historical performance of an asset or portfolio when external cash flows are present in the equation.

For example, if in your very own 401k, you make a transfer of funds from your money market account to purchase shares of a mutual fund, you would not want to count that influx of capital towards the overall rate of return on that fund (or your entire portfolio) as it would be inaccurately skewing the results in a positive manner. Conversely if you sold off a holding, or made a withdrawal, that could artificially skew portfolio performance in a negative direction. For more information on the definition and derivation of the time-weighted rate of return, please refer to this Wikipedia entry.

Understanding the TWROR Formula

For the purpose of this exercise, we will be using the following formula for calculating TWROR:

Where:

  •  is the time-weighted return for the portfolio
  •  is the initial portfolio value
  •  is the portfolio value at the end of sub-period 
  •  is the net inflow which occurs in sub-period 
  •  is the number of sub-periods

What you will notice here is that this formula is a geometric series, otherwise known as a product or compounded calculation. Essentially we will calculate each sub-period’s rate of return (in this case a month) and then take the product of all of those sub period returns to yield the overall true time-weighted Rate of Return for the series of sub periods (in our example a year).

Example: Manually Calculating a Quarterly Portfolio TWROR

Period Beginning MV Ending MV Net Flow Period RoR
201101 $1,160,408.07 $1,158,376.53 ($575.79) (0.13%)
201102 $1,164,886.97 $1,172,048.35 $0.00 0.61%
201103 $1,170,999.41 $1,184,244.77 $0.00 1.13%

Given the above data set, we would like to manually calculate a quarterly TWROR to demonstrate how the formula is applied.

  1. First we calculate our sub-period rate of return using the following formula:
    manual-twror-step1
  2. Then we chain all of our sub-period rates of return together to come up with the final time-weighted result for the quarter:manual-twror-step2

If we were to calculate this number in Excel, we would simply use the PRODUCT function to multiply all of the rows of values in a given column together to give us the final TWROR. Because there is no equivalent aggregate function in Report Studio (or SQL for that matter) we need to use a little mathematical trickery to come to the same solution. This is actually were most report developers throw their hands up and ask their users to finish their analysis in Excel. We are going to show you how to do 100% of the work in report studio.

Calculating the TWROR in IBM Cognos Report Studio

We will be using IBM Cognos 10.2 Report Studio for this example, but this approach will work for any version of IBM Cognos.

  1. Start by creating a simple list report in report studio that has the following fields from your investment data mart:

    1. Sub Period (Year Month Number)
    2. Period Beginning Market Value
    3. Period Ending Market Value
    4. Net Capital Flow (Deposits – Withdrawals)
  2. Filter your list report by a single year, and/or portfolio
  3. Create a data item called Periodic Rate of Return with the following calculation:((-)/)-1
  4. Test your report and confirm that your periodic ROR calculation is accurately representing returns, net of any capital movement.
  5. Select the Query Explorer in Report Studio and drag a new query from the toolbox and rename it to Portfolio Total.
  6. Select the query from your list report (which we renamed to Periodic Holdings) and drag it to the right of your Portfolio Total query until a black bar appears, at which point release the mouse. Your new Portfolio Total query now references the Periodic Holdings query. We do this to force report studio to keep our sub-period ROR calculations at the correct level of detail.
  7. Double click your Portfolio Total query and drag a new data item from the toolbox into the data items list. Enter the following calculation and give the data item the name TWROR:exp(total(ln(1+.)))-1
  8. This is the mathematical trickery we were referring to before. The geometric series or product function can be replicated by taking the exponent of the sum of the natural logarithm of those values. This technique can be used for any geometric calculation you need to reproduce in SQL or Report Studio.
  9. Switch back to the page explorer, and drop a new list or singleton in your report that references the Portfolio Total query, and make sure the new TWROR item is present.
  10. Export the contents of your report to Excel and validate your numbers using the PRODUCT function.

We used two queries in this example to achieve the result. We could have done it all with a single more complex query, but that can sometimes require local report processing depending on the type of database you are using. A report specification for IBM Cognos 10.2 Report Studio is attached for your reference. Hopefully this technique allows you to simplify the lives of your portfolio analysts by arriving at answers faster without having to use multiple tools.

Next Steps

If you’re embarking on an initiative to provide better business analytics for your organization in the areas of investment management, institutional or private equity asset management, and hedge funds or other related financial services sectors, we encourage you to contact us for more information. Our financial services business analytics experts are familiar the unique challenges of the industry and deeply attuned to the needs of your analyst community. Our unique combination of industry experience and IBM Cognos domain expertise enables us to rapidly arrive at high impact solutions that are tailor made for your financial services organization.

For an updated version of this blog post using IBM Cognos Analytics 11.1.7, click here.

For users of IBM Cognos Workspace Advanced (formerly Business Insight Advanced), a popular request is to have the ability to highlight every other row in a list report. This technique has been demonstrated with IBM Cognos Report Studio using the running-count() and mod() functions. The issue is that IBM Cognos Workspace Advanced does not expose all functions that can be used in query calculations, so users think they are not available.

This article will demonstrate how to highlight every other row using IBM Cognos Workspace Advanced by entering a ‘non-exposed’ function in the expression editor (the twist!). Read more

A request we often get is to build more dynamic dashboards and reports. This can be accomplished by a combination of Report Studio prompt reports, portlets, drill-up/drill-down and filtering. The key to this interactivity is communication between IBM Cognos portlets and channels. Utilizing channels allows us to create dynamic filtering and drilling capability. This article will explain the basics of using portlets and channels and provide a sample of how to create a dynamic dashboard. Read more

With the introduction of Active Report, IBM Cognos 10 report designers now have the ability to quickly and effectively create dynamic, powerful, interactive, self-contained reports available offline and on the go, which are highly sought after by report consumers.

Active Report’s intuitive, drag and drop interface makes it incredibly easy to add interactivity and functionality to reports, including variable text items, tab controls, and data decks.

To illustrate the ease of use, this tutorial will walk you through the steps for creating a simple report containing a data deck in Active Report. Data decks allow report developers to add modern and visually appealing animations to reports. Using master-detail relationships, a variety of data containers can be inserted into a deck and updated to show only values selected in an Active Report control.  Read more

In the past, we have introduced techniques around dynamic prompting by utilizing a number of Cognos Report Studio built-in features. Occasionally there are scenarios that will necessitate the need to set a report parameter without prompting the user to select a value. For instance, there may be a case where the report developer needs to pass both the selected year and the previous year to a stored procedure or pass in a calculated prompt value that would be based on previously selected prompt values. While there are a number of solutions for such scenarios, in this article we will focus on a Javascript based technique to provide the necessary functionality. Read more

The Ironside Group is excited to once again publicly offer both our Fundamentals and Advanced Report Studio Training courses in back-to-back fashion. As with all of our course offerings, this curricula is lead by our veteran consultants who have decades of in-depth applied technical experience with IBM Cognos software. Take advantage of this special combined offering and become a Report Studio guru in a weeks time.

Course: IBM Cognos 8 Report Studio Fundamentals (View Description)
When: February 14-16, 2011

Course: IBM Cognos 8 Report Studio Advanced (View Description)
When: February 17-18, 2011

Where: Ironside Group, Lexington, MA (Boston)
Read more