Enable Bimodal Analytics with Cognos Analytics: Part 2

In the first installment of our series on bimodal analytics, we talked about the origins of Mode 2 analytics. We looked at some of the challenges around implementing true bimodal analytics within IBM Cognos Analytics 11 and touched on some of the vendors who were born as Mode 2 platforms. This second installment will focus specifically on how to enable Mode 2 analytics within the organization using Cognos.
As previously mentioned, IBM Cognos has long been the standard enterprise class business analytics platform. From the beginning, Cognos was built with the enterprise in mind. From its scalability, to its ability to deliver enterprise level reporting across the organization, to its trusted enterprise metadata layer, Cognos has demonstrated why it’s a leading enterprise analytics platform. While enterprise capabilities have garnered less attention in recent years with the marketplace focusing instead on visualizations and the self-service end user experience, these capabilities are still an integral part of making Mode 2 analytics a complete, trusted, and successful business analytics solution.
Capabilities
The key Mode 2 capabilities within Cognos Analytics are Dashboards, Stories, and Data Modules. Dashboards are the self-explanatory, standard capability that is common across all analytics tools birthed in the Mode 2 era. Dashboards are easy to use, quick to build and distribute, and contain impactful and eye-catching visualizations. They enable people outside of IT – the non ‘power users’ – the ability to create compelling analytical assets, with minimal or no training. Building upon dashboards, Stories allow the user to enrich a dashboard by creating a meaningful and informative narrative experience. Stories are a visual “slideshow” view of the dashboard that use animations and transition features to create a narrative over time that can be useful for conveying conclusions or recommendations to less technical audiences.
Finally, the key (and often underutilized) differentiator that enables all of these capabilities, Data Modules. Data Modules introduce an efficient and powerful self-service “data wrangling” capability to Cognos Analytics.
Data Modules enable you to combine your own personal or departmental data sets with curated, trusted enterprise data sources that have been exposed previously through Cognos Analytics, whenever you need to, without the need for IT interaction or involvement. Maybe it is data from a newly acquired company, or data from a 3rd party vendor. Instead of waiting for this data to be added to your data warehouse and exposed through traditional metadata models, Data Modules give you the ability to create relationships that join these disparate data sets, allowing you to glean insights that were previously difficult, if not impossible to find. Add to that the ability to create Data Sets, a columnar-based ‘cache’ of specific data from a Data Module, and you now have a highly performant way to combine multiple data sources to feed your dashboards and stories for an unrivaled Mode 2 analytics experience.
Bimodal Analytics
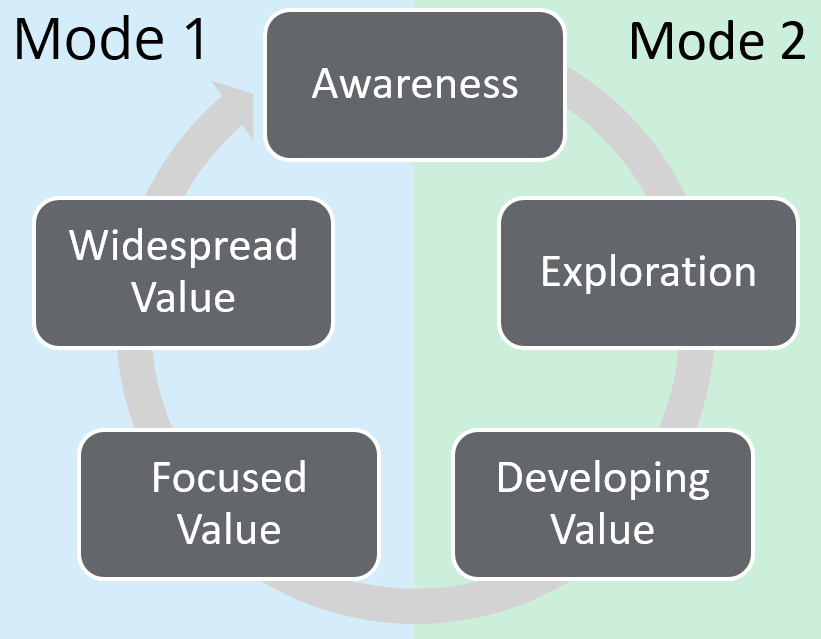
The most recent major release of Cognos Analytics (v11.1) provides a complete solution for Bimodal reporting and analytics lifecycle. Cognos has always been the leader in the Mode 1 style of reporting and analysis, providing trusted reports, dashboards, event-driven notifications, and other content for the enterprise. Cognos Analytics also provides an easy to use self-service interface, delivering compelling visualizations via dashboards and stories against external data sources. These new data sources can provide a fresh perspective for business analytics looking for a competitive advantage.
Going one step further, Cognos Analytics allows those same analysts the flexibility to join that new, fresh data back to the core, trusted enterprise data sources, giving them increased insight into both. All of this is accomplished quickly, within the same, intuitive, self-service environment without any need for IT intervention. At this point, the analyst can decide… Is this data providing new insight into my business and worth continuing with, or is it merely proving what we have known all along? Answering these questions will help determine whether this new data is discarded or possibly used as is through this Mode 2 process. Or, is it valuable enough to add to the trusted enterprise warehouse, closing the loop back into Mode 1, freeing the users to explore new data for additional insights and value?
Use Case
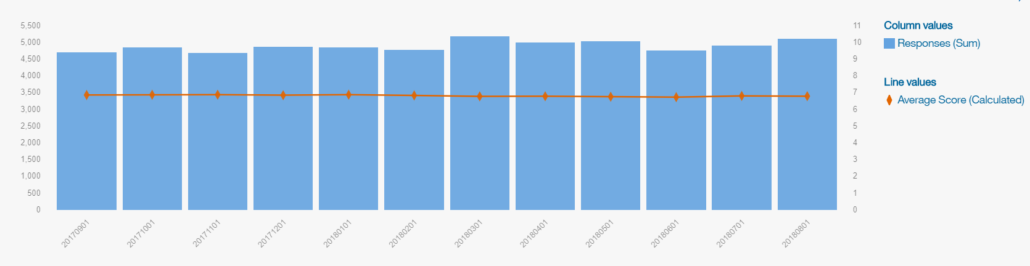
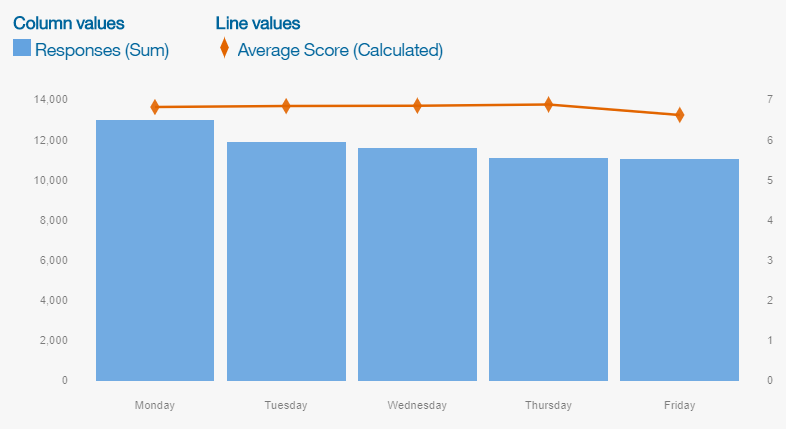
Let’s look at a use case scenario. A health care organization’s Call Center manager has a data mart that stores customer contact (calls and chats) and a number of call center metrics. He now has access to high level survey data from their customers about the call center experience. The data is a ‘test balloon’ to see if it is worthwhile to spend time and resources to bring it into the enterprise data mart (basically just the number of responses and the average score aggregated from the 4-5 questions that are asked). The manager has been given a text file export of the data as a starting point. He imports the data into Cognos Analytics and builds a quick dashboard to see how things look. The visualizations primarily confirm what they already expected… survey results are relatively consistent over the last 12 months…
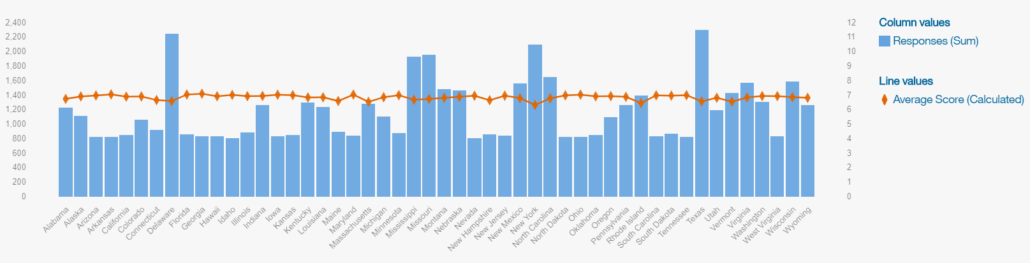
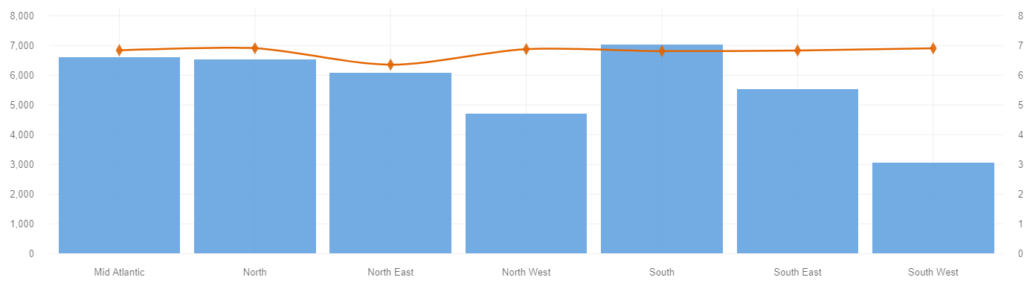
and across the country based on the policy state…
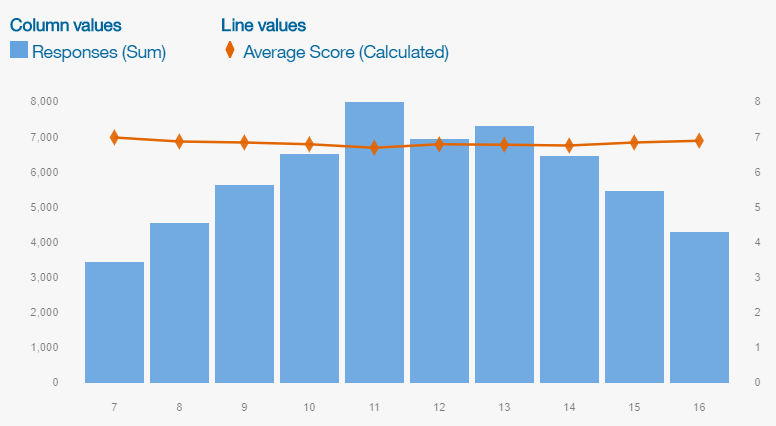
…and not surprisingly, the survey scores fluctuate slightly by time of day as contact volumes increase and decrease.
But he does notice a slight dip in survey results on Fridays over the last 12 months.
So he quickly creates a new Tree Map visualization to show the number of Responses and Average Score by Policy State and Weekday…
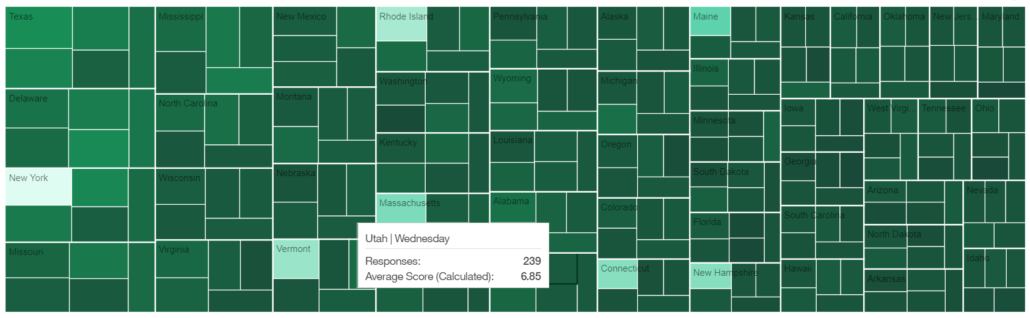
and sees that the Northeast states are showing lower than average survey responses on Fridays over the last 12 months.
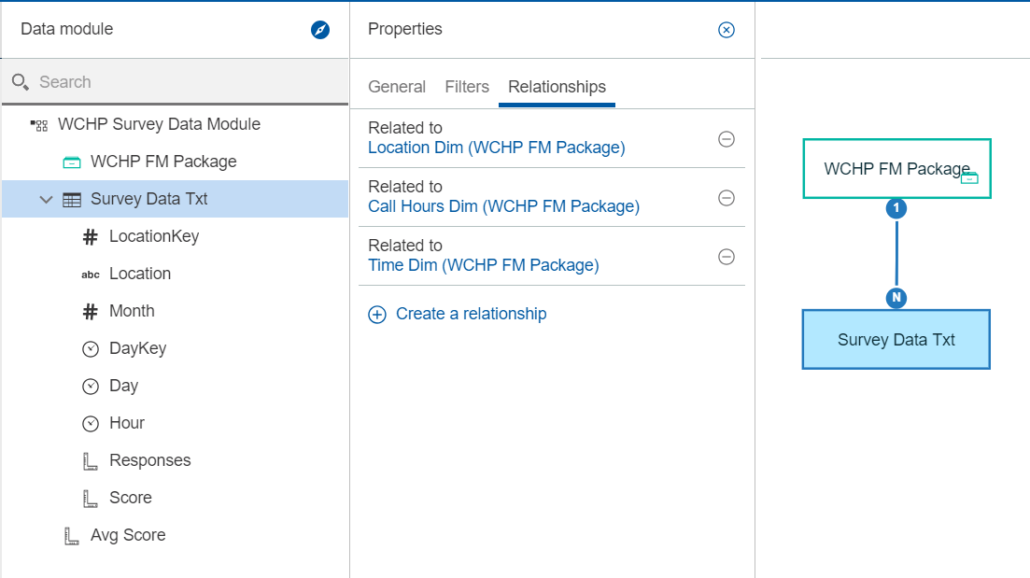
With this new found insight, he decides to dig a little deeper. There is obviously an issue on Fridays in the Northeast, but the survey data only shows him part of the picture. He quickly builds a Data Module in Cognos Analytics, tying the survey data back to his enterprise Call Center data mart, which has been modeled in Framework Manager and made available as a package for reporting and analysis. He is able to link the survey data to his location dimension that shows Territories and Regions, the Region being the actual location of the different physical call centers and the States they support as well as the corporate Time Dimension and Relative Time Dimension data.
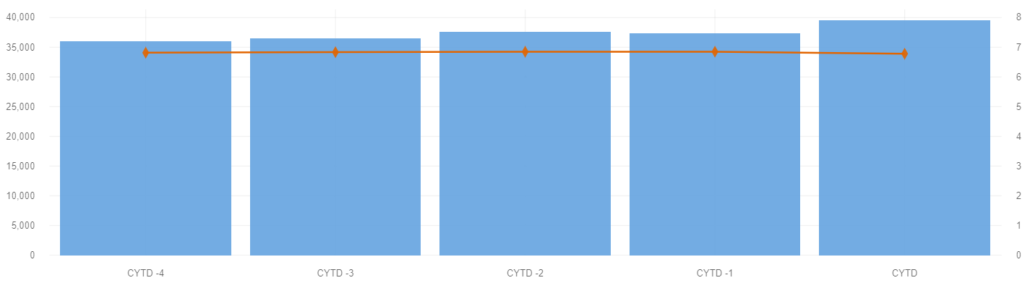
Now he is able to see this new survey data across familiar dimensions such as Year to Date (YTD)…
or by Territory and Region…
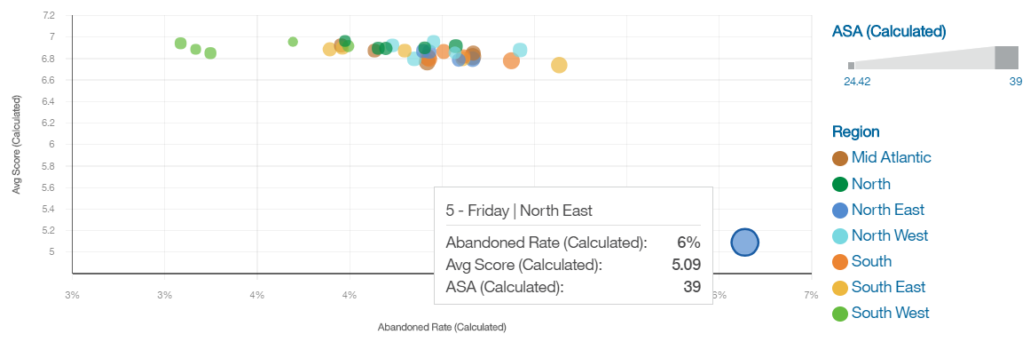
and side by side with corporate metrics such as Average Speed to Answer (ASA), Abandoned Rate, Hold Rate, and more.
Now an informed decision can be made as to the true value of this new data and how it fits with our existing, enterprise data sources. Data that provides important, new insight into the business can now be vetted and added to the corporate data stores, closing the loop.
In the third and final part of this series, we will walk through a demo on how all of this fits together and discuss some of the features and capabilities in Cognos Analytics 11.1 that make this story even more compelling.

About Ironside
Ironside was founded in 1999 as an enterprise data and analytics solution provider and system integrator. Our clients hire us to acquire, enrich and measure their data so they can make smarter, better decisions about their business. No matter your industry or specific business challenges, Ironside has the experience, perspective and agility to help transform your analytic environment.

