
Highlight Alternating Rows in a Report Using IBM Cognos Analytics (11.1.7)

For users of IBM Cognos Analytics a popular request is to highlight alternating rows in a report. This article will demonstrate how to achieve this result using the list container and the property Conditional Styles.
In order to create the report, the following objects will be used:
| Object | Definition |
| List container | Contains report data |
| Query Calculations | Create calculations |
| Running-count() function | Get sequential numbers |
| Mod() function | Get remainders of 0 or 1 |
| List columns body style ancestor | Ancestor object used to highlight the data |
| Conditional styles | Create type of style |
Finished Product
When the demo is finished your report will look similar to the following:
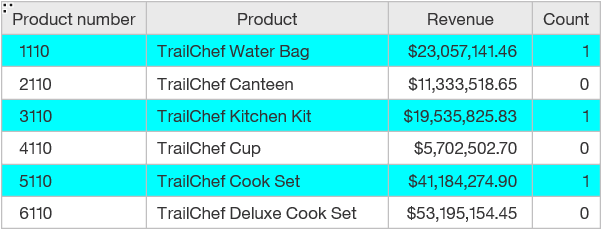
Let’s get started. The first thing we’ll do is create a simple list report using the sample GO Sales (query) package included with the application. However, you can use any data to follow along.
Create the query calculation
- Select the blank template and create a report using the List container.
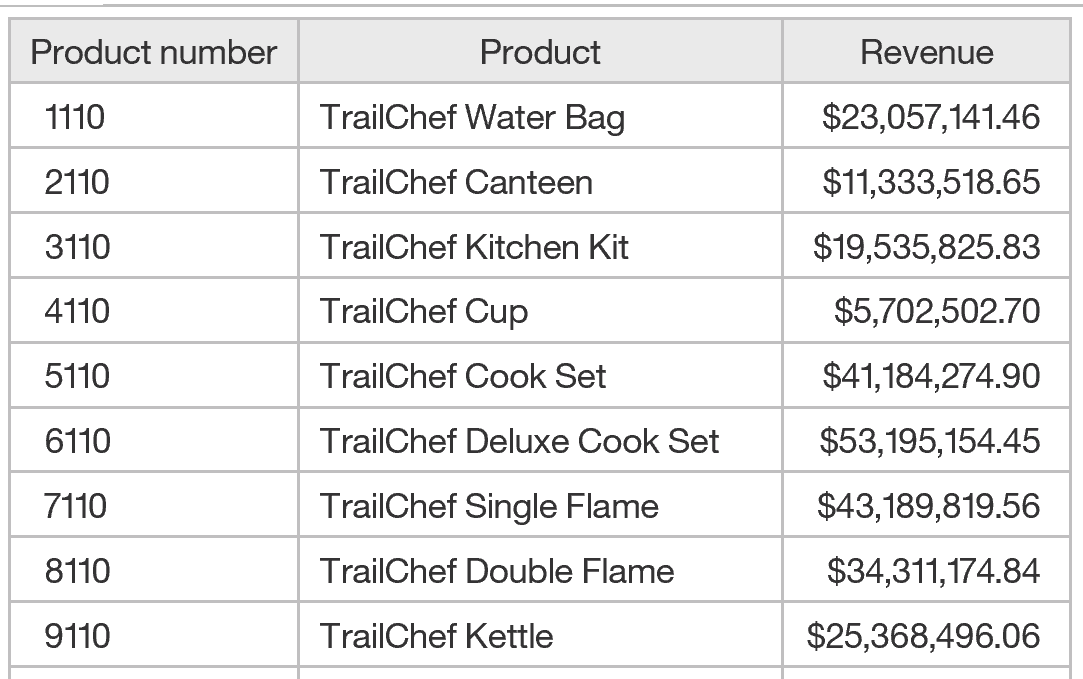
- From the Sales(query) namespace add the Product number, Product and Revenue data items to the list.
 |  |
- View the report in Page Preview.
 |  |
- From the Toolbox, add a Query Calculation to the end of the list container next to Revenue. The Data item expression dialog will open. Name the calculation Count.
- Click the Functions tab at the bottom of the screen.

- Open the Summaries folder and double click the running-count() function to add it to the expression. This function returns the running count by row for a set of values.

- Click the second tab on the dialog box, Data Items
, and drag the Product Number to the function. Add the ending parenthesis.
Running-count(Product number)
- Click OK to view the results.
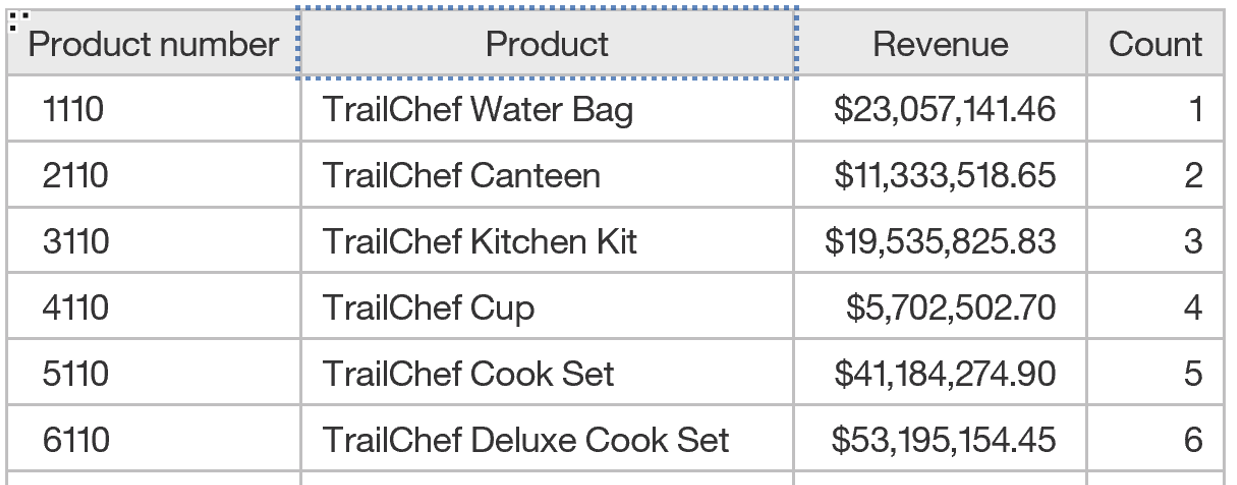
The result of the running-count() function will show sequential numbers on each row.
Create Values to Highlight
The mod() function returns the remainder of two numbers. In our case it will generate the numbers 0 or 1 after the division takes place.
We will nest the mod() function around the running-count() function to achieve this result.
- Double-click the Count column title to return to the Data item expression.
- Modify the expression as follows.
mod(running-count("); copyLinks.forEach(function(link) { if (link.hasAttribute("data-listener-added")) return; link.setAttribute("data-listener-added", "true"); link.addEventListener("click", function(e) { e.preventDefault(); var tempInput = document.createElement("input"); tempInput.value = window.location.href; document.body.appendChild(tempInput); tempInput.select(); document.execCommand("copy"); document.body.removeChild(tempInput); var originalText = this.querySelector(".social-sharing-icon-label")?.textContent || ""; var originalTitle = this.getAttribute("title"); var originalIcon = this.querySelector("svg").outerHTML; // Show success feedback this.setAttribute("title", "Copied!"); this.classList.add("copied"); if (this.querySelector(".social-sharing-icon-label")) { this.querySelector(".social-sharing-icon-label").textContent = "Copied!"; } else { this.querySelector("svg").outerHTML = ''; } var self = this; setTimeout(function() { self.setAttribute("title", originalTitle); self.classList.remove("copied"); if (self.querySelector(".social-sharing-icon-label")) { self.querySelector(".social-sharing-icon-label").textContent = originalText; } else { self.querySelector("svg").outerHTML = originalIcon; } }, 2000); }); }); });