Ironside Tech Tip: Capture Social Media Sentiment as It Happens

Use the SPSS Modeler Text Analytics Add-On to Monitor Social Media
As channels of social media penetrate people’s daily life more extensively and intensively, bad reviews and negative opinions travel faster than ever before. Research and surveys have shown that people are far more likely to spread the word about bad experience than a favorable one . Social media, by providing numerous opportunities for word-spreading, escalates this process. It is in the best interest of businesses to monitor comments on social media in real time.
IBM SPSS Modeler, with its Text Analytics Add-on, provides a powerful and convenient suite to deploy for the purpose of monitoring social media and transforming the unstructured data from text to structured data for deeper analysis. We will provide a simple example of sentiment analysis to illustrate the process here.
Building a Concept or a Category Model
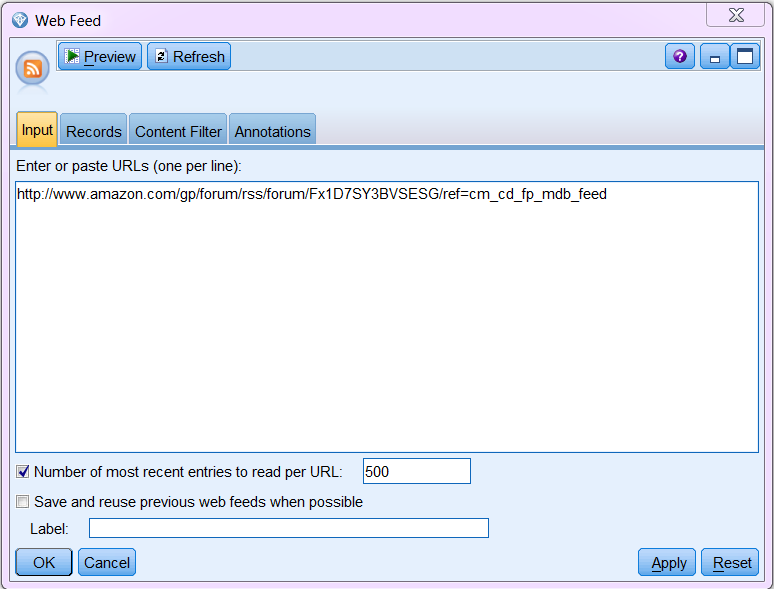
Many public forums and Twitter allow you to subscribe to RSS feeds or even to create your own customized RSS feeds. We will use Amazon’s Kindle Forum as an example for this analysis. Amazon provides a URL to this forum’s RSS feed. On the SPSS Modeler canvas, add a Web Feed node to it and input the URL to the RSS feed of the Kindle’s discussion forum (Fig. Web Feed Node).
Please note that an RSS web feed is usually XML-based. You can, however, also analyze an HTML-based webpage. In that case, you have to specify a Non-RSS record start tag on the Records tab of the Web Feed node.
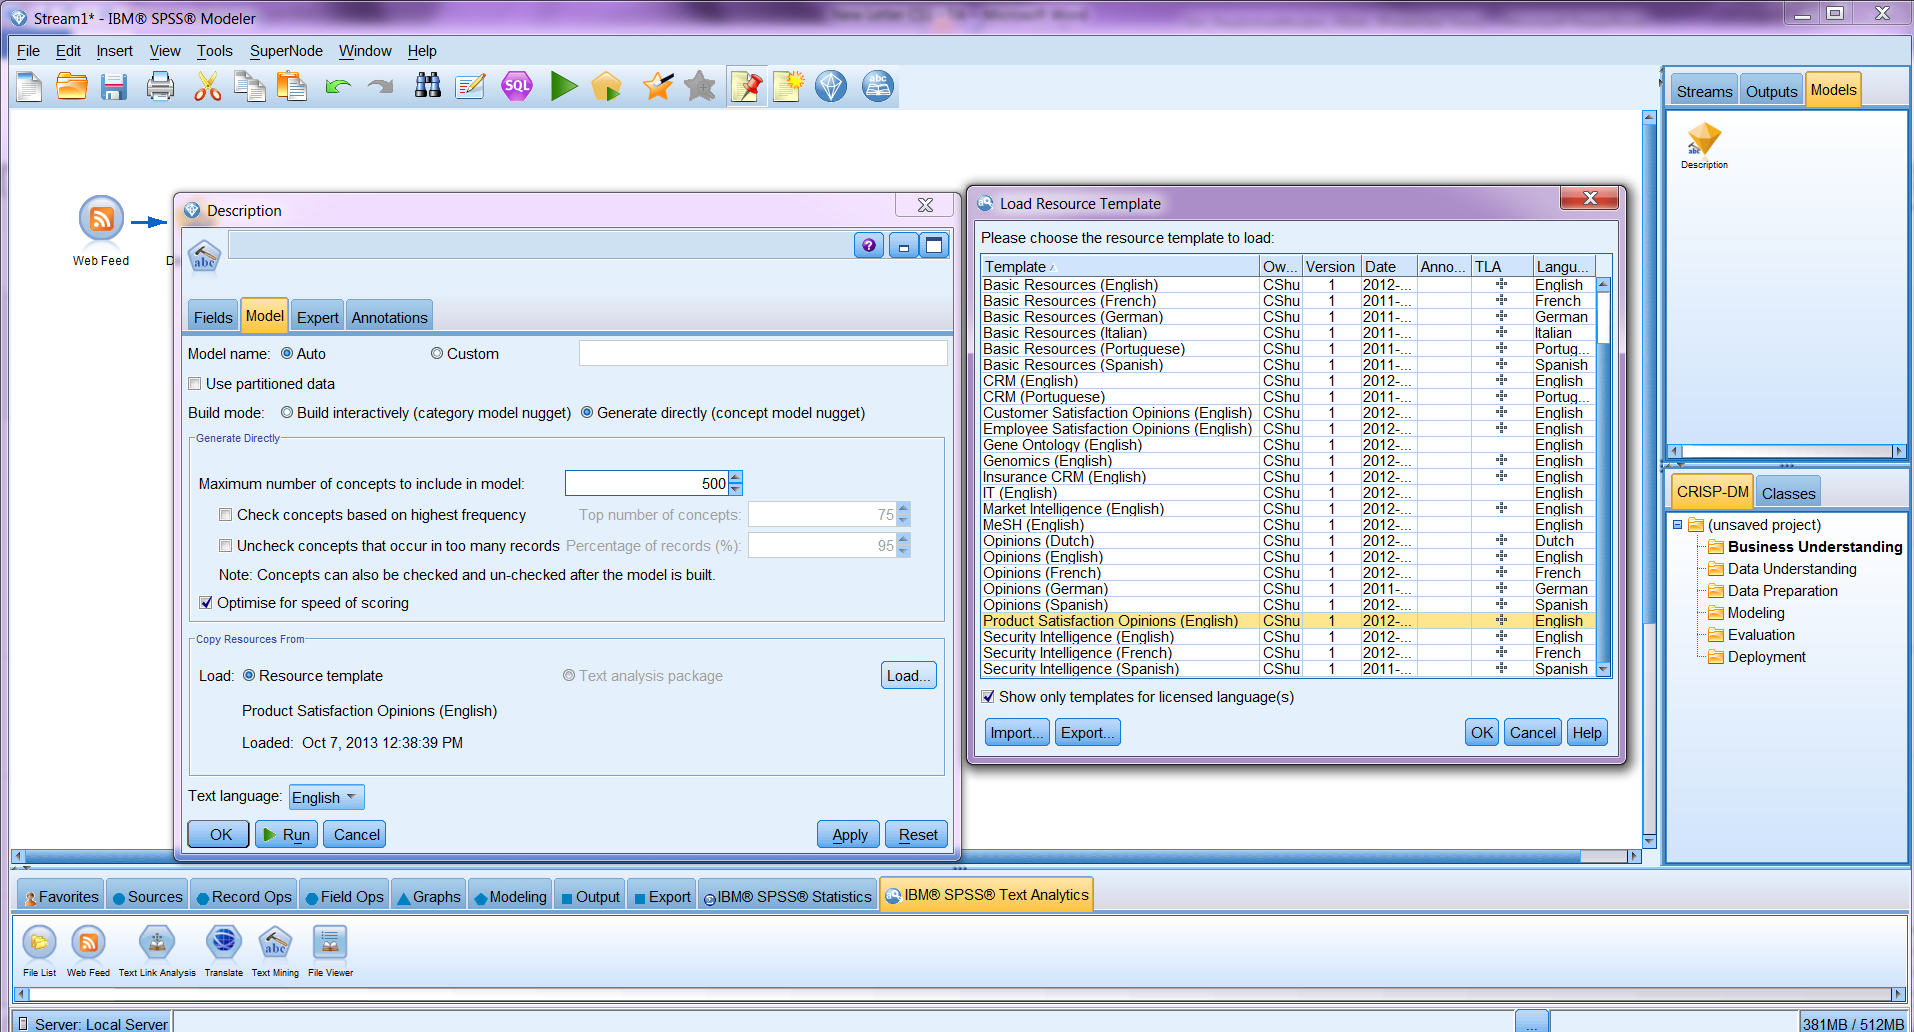
Connect a Text Mining node to the Web Feed node.
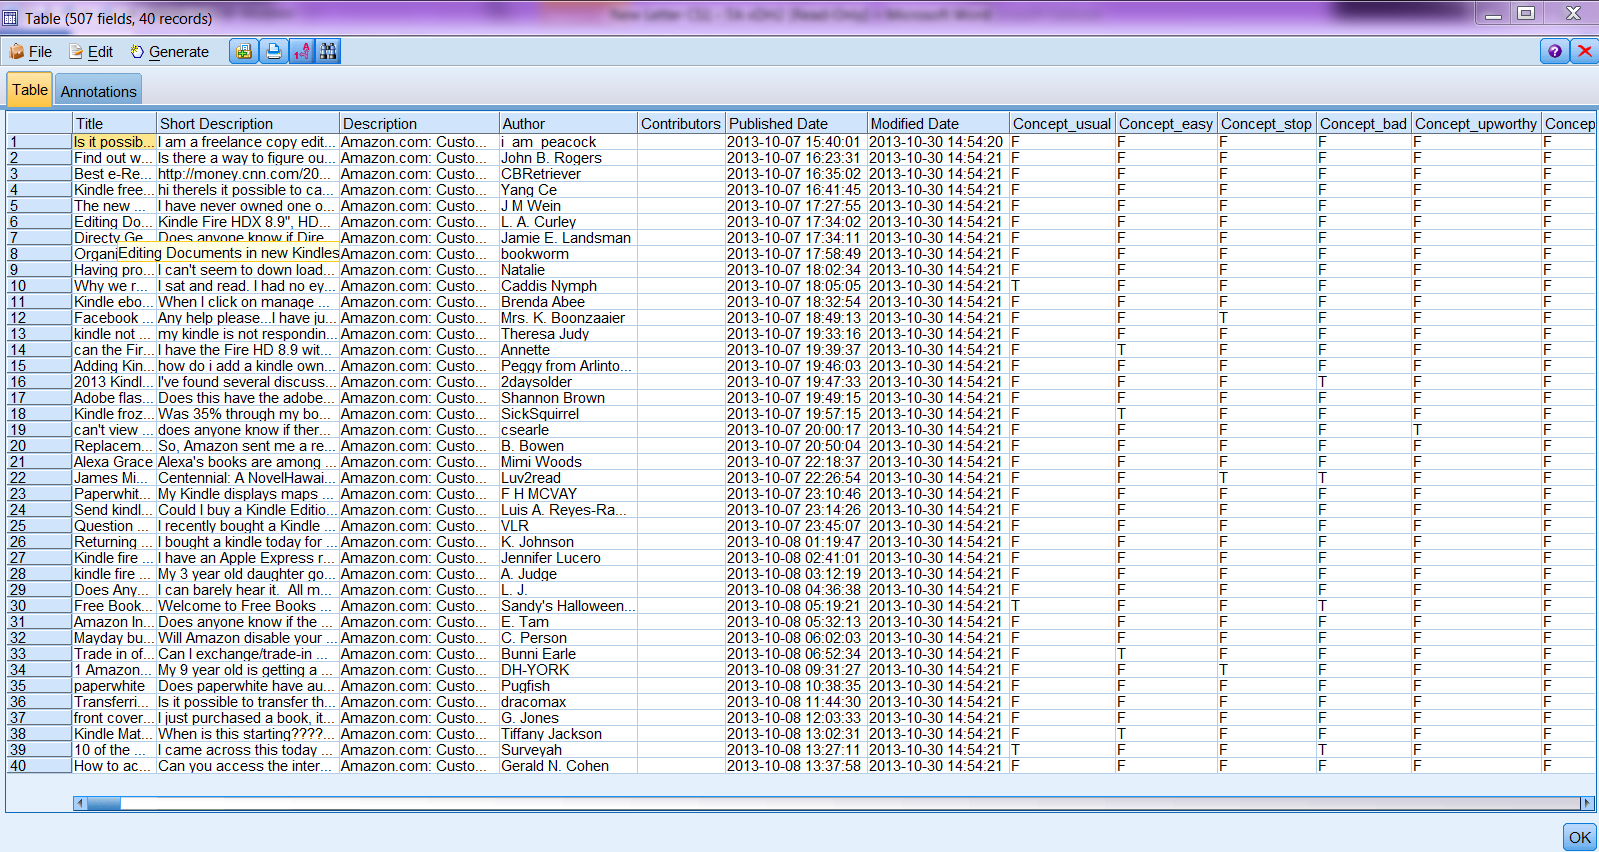
From the Text Mining node, by specifying a language resource (collection of dictionaries and libraries containing common concepts appearing in a specific domain) based on which the concepts and (maybe) text links are extracted and categories are built (if the resource also contains text links or category definitions), you can build either a category model or a concept model. Concepts are elements (words and phrases) extracted from the text and are the building blocks of categories. Choosing to build a concept model will generate a model nugget directly without going through the interactive process. The model nugget adds dummy variables marking the occurrence of each concept in each record. On the other hand, choosing to build a category model will open an Interactive Workbench, in which one can revise the definitions in dictionaries, exam the text links and see the instances/records of each concept or build categories.
The category model and concept model options are two ways of turning unstructured data to structured data. If you choose to build a category model nugget, the new variables will be dummy variables of built categories. Even if you do not want to generate a category model nugget, it is recommended to run your first analysis interactively on a web feed URL or a piece of text of a certain subject so that you can refine the resources, dictionaries, and libraries based on which concepts are drawn from the text. If you have done the analysis on a certain web feed URL multiple times and revised the synonyms, fuzzy grouping, category definitions, exclusions, etc. in the libraries many times, and you are not interested in categorizing the concepts or exploring the text link patterns, you may feel it is not necessary to build the node interactively.
After choosing to build a category model, an Interactive Workbench opens with the bottom left pane filled with extracted concepts and their corresponding types as shown below.
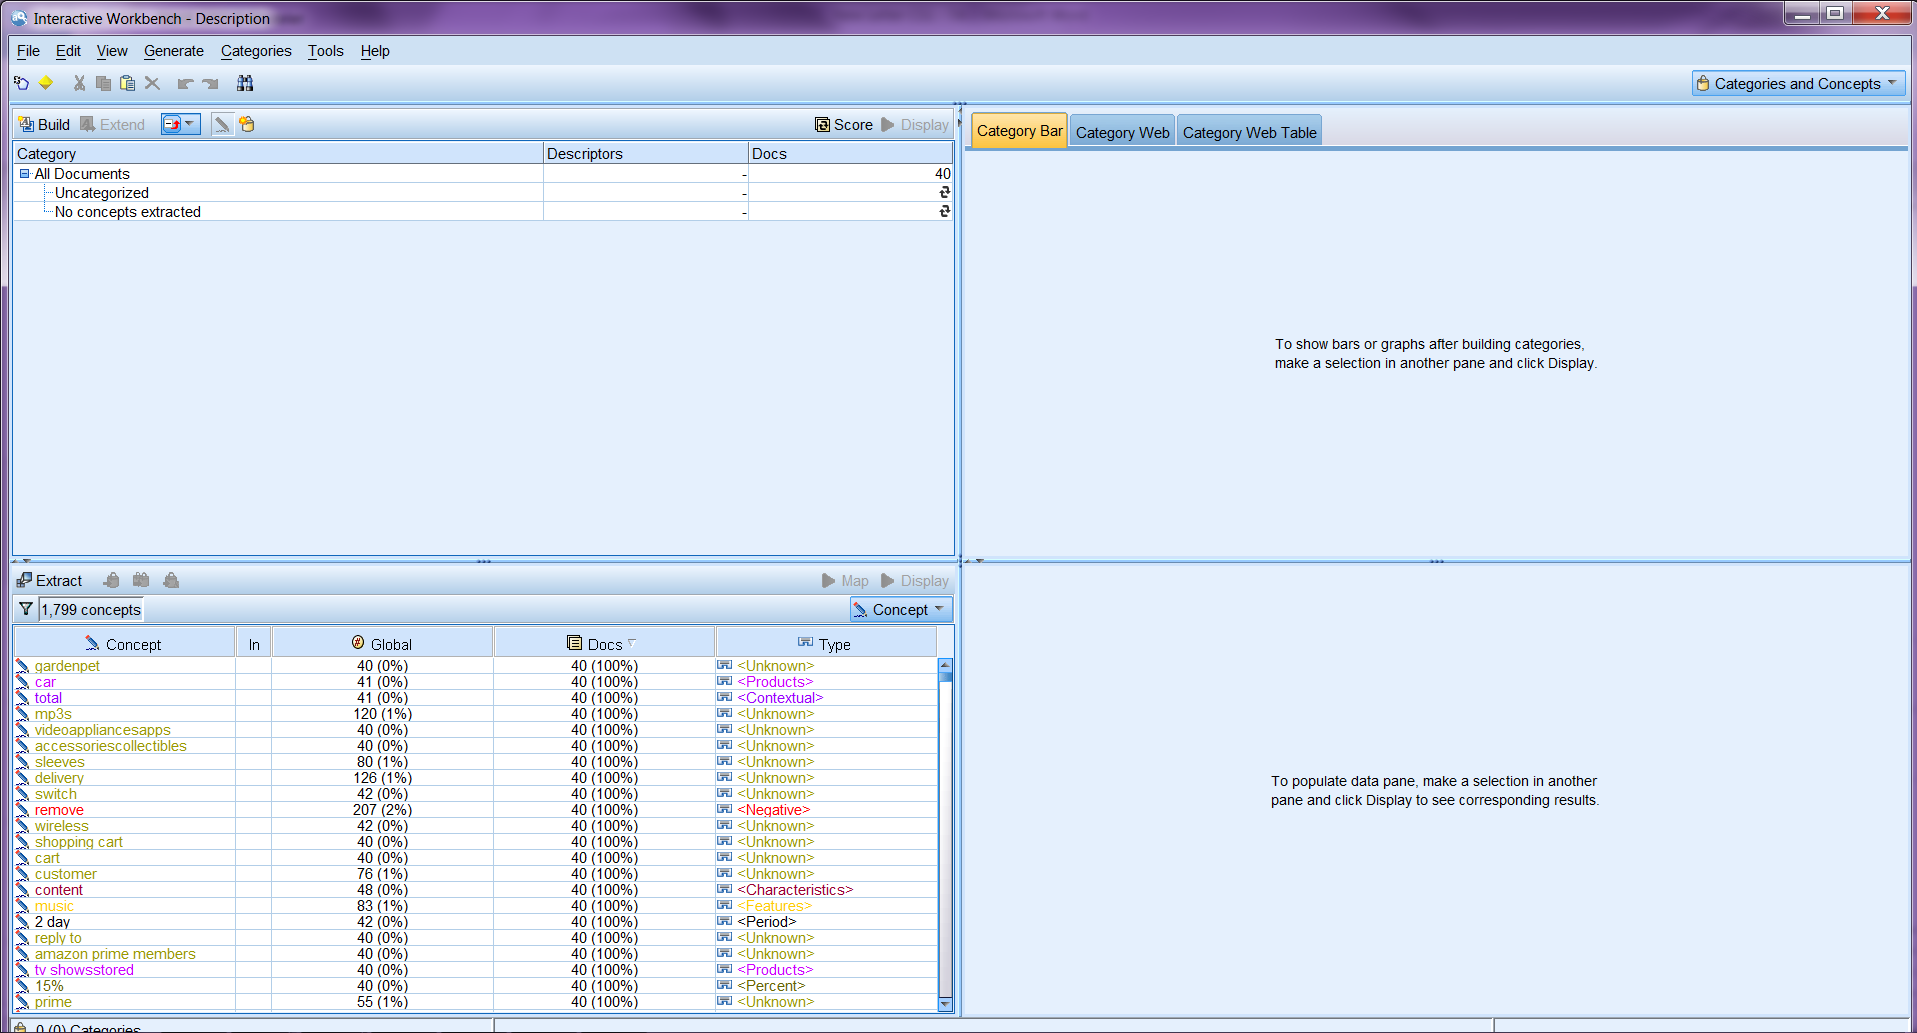
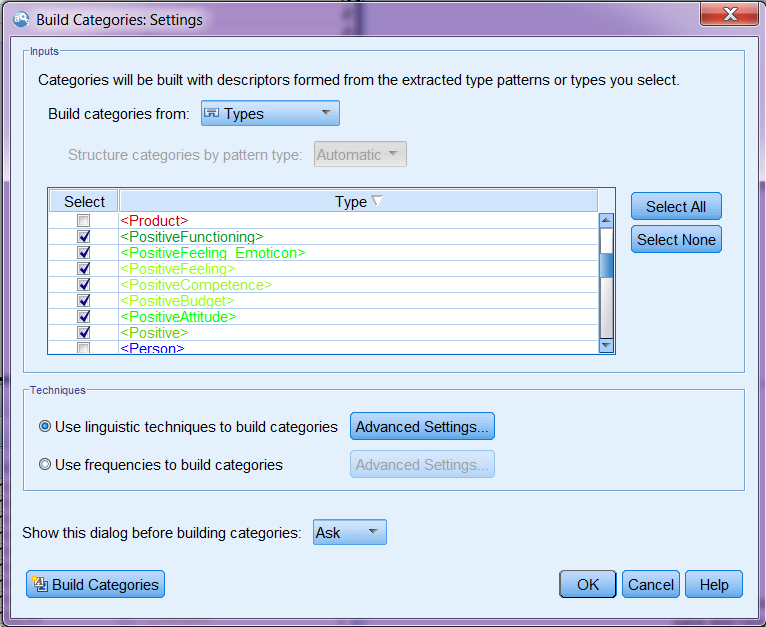
We can build categories from here. A category represents higher-level concepts or topics to capture the key ideas, knowledge, and attitudes expressed in the text, and is made up of a set of concepts, types, and rules. When choosing the settings for building categories, you can specify which types of concepts you want to include to build categories.
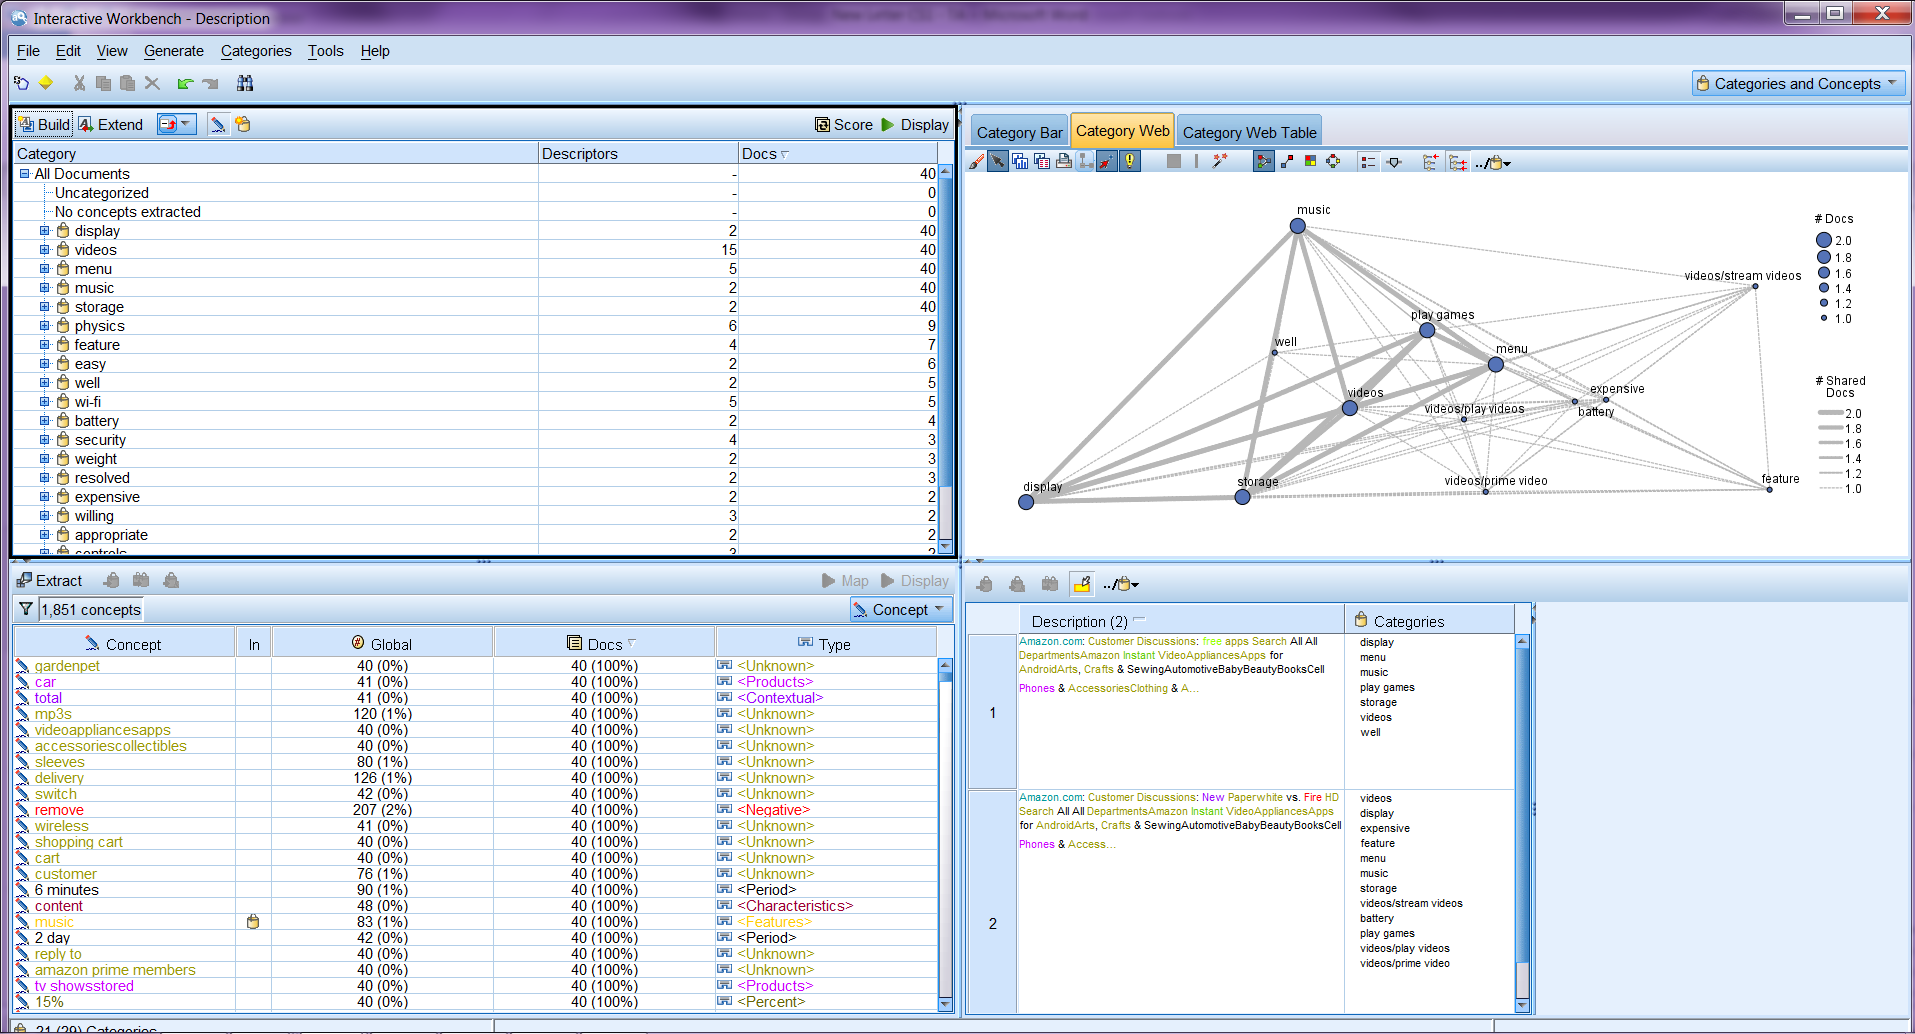 Interactive workbench with the categories built and showing the category co-occurrence
After categories are built, you can score each category (the frequencies of each category). By highlighting a category, you can see the co-occurrences between the highlighted (sub)category and other categories (if they ever appear in the same record(s) with the highlighted (sub)category) in three different formats depending on which tab you choose in the right upper Category Relevance pane. The lower right Data pane displays all the records of the selected (sub)category and all the categories they belong to. If the results shown on the right two panes are not satisfactory, you can also revise category definitions in the Category pane to tailor the categorizing result.
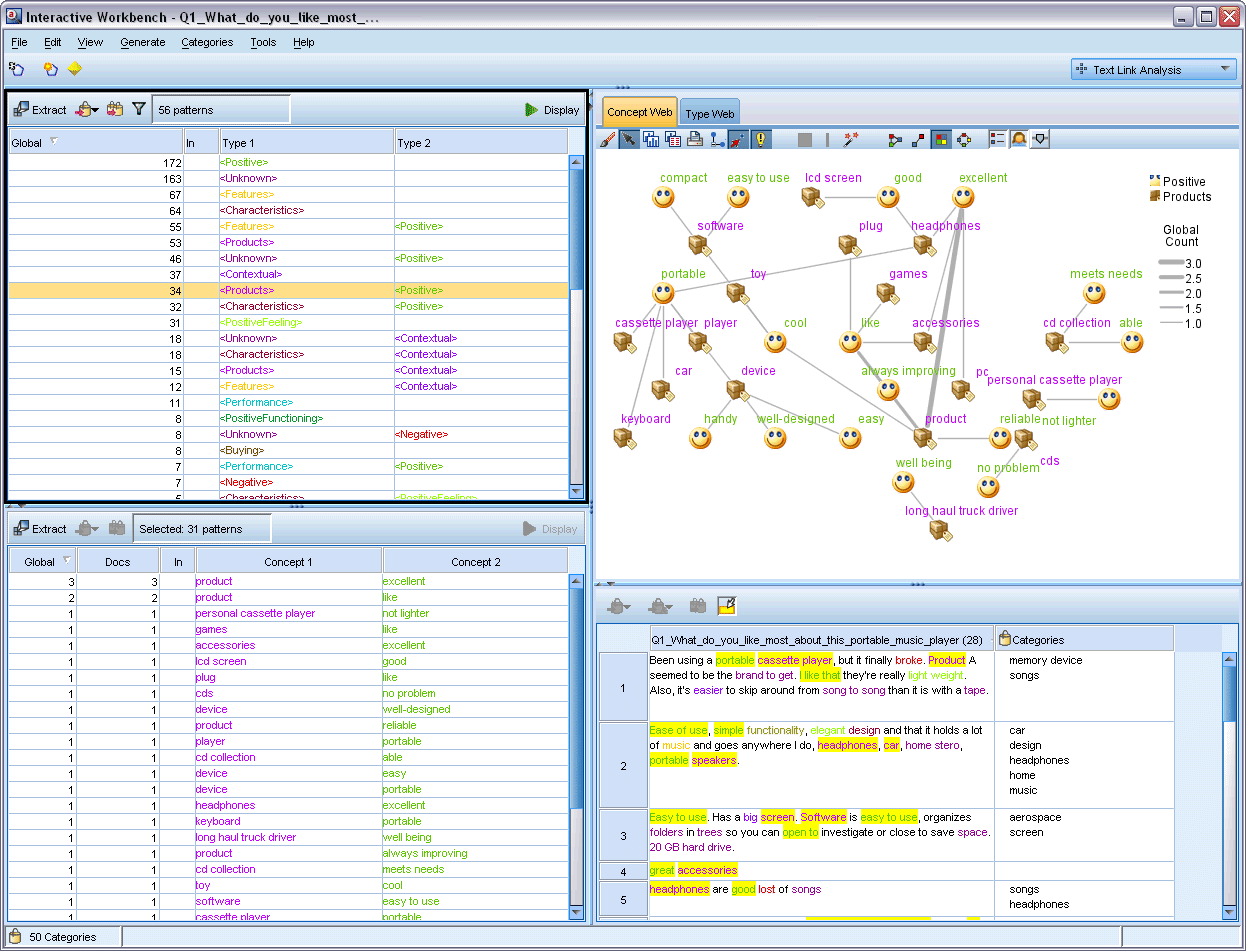
Text Link Analysis
Switching the analysis mode at the dropdown menu on the top right of the Interactive Workbench leads you to Text Link Analysis mode. Extracting ideas about an organization may not provide enough insight into the sentiment associated with the organization on social media. This is where text link analysis becomes particularly useful. For example, extracting your competitor’s product name may not be sufficient. In this case, you can look at the extracted patterns to see if you can find examples where a document or record contains text expressing that the product is good, bad, or expensive.
Transforming to Structured Data
With a model nugget of categories generated from the Interactive Workbench or a concept model nugget generated directly from the Text Mining node, you can generate fields containing information about extracted concepts or built categories. Note that there are two Scoring Modes for variable creation: Categories as fields and Categories as records. We will just leave the default selection as it is. The difference between the two modes are that Categories as fields will generate a flag field for each of the categories selected on the Model tab while Categories as records will generate only one field of a category. New records are created for each combination of every original record and the categories it belongs to.
Categories as fields are very helpful in sentiment analysis as you can see how often concepts of noun categories (feature, characteristics, performance, etc) appear with negative and positive categories and set a cutoff value for raising flags for deeper investigation. You can even combine the derived text data with other demographics data to predict consumers’ purchase patterns based on the statements they make on social media.
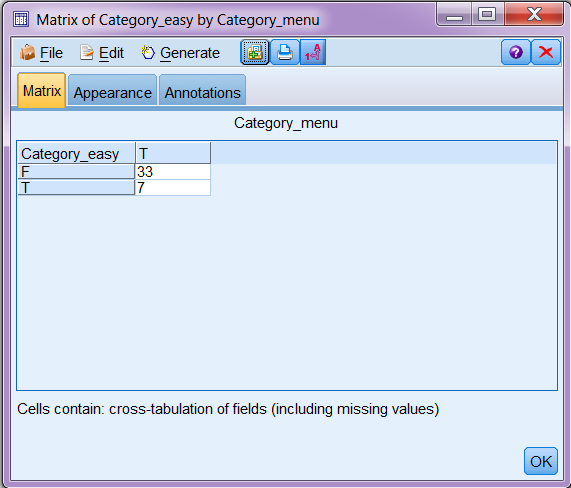
We will just give a simple example here. If we connect a Matrix node to the model nugget and set Category_easy as rows and Category_menu as columns, we will get a crosstable similar to the figure below (please note as the comments are constantly updated to the RSS feed, you may get completely different set of categories or frequencies and co-occurence of the same categories).
Edit Language Resources
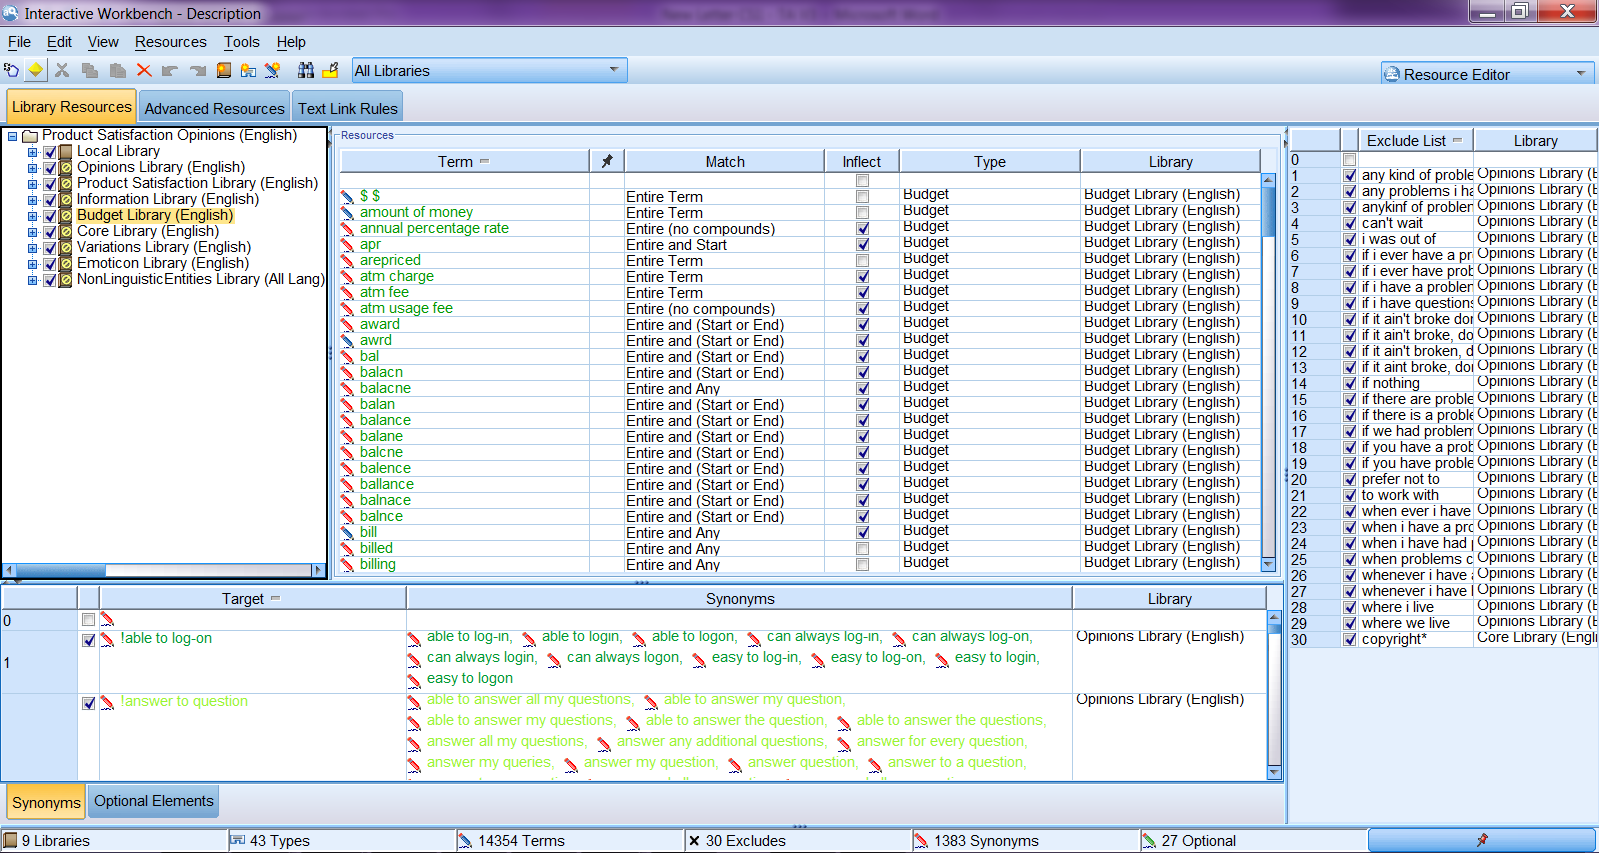
A lot of information is conveyed in text. In order to extract as much and accurate information as possible, we need to be able to update the language resources easily and effectively. Luckily in SPSS Modeler Text Analytics, it is very easy to revise the definitions included in the language resources. As shown below, in the resource editing mode in Interactive Workbench, we can easily revise the definitions of synonyms, concepts, types, exclusions, and other advanced resources and Text Link patterns on the other two tabs.
If you’d like deeper insights into social media analytics techniques or other predictive modeling methods, the Ironside Data Science & Advanced Analytics team can help. They will help you define the resources you need to begin tracking and anticipating your customers’ behavior. You can also check out the second article in this series for further details.